Delightful, strategy-shifting, and totally free ideas for your next data viz

Labels are Used Sparingly

This post is about how to avoid inducing claustrophobia in your data visualizations. Too much text on a graph clutters it up, making readers feel suffocated. So let’s address the checklist item Labels are used sparingly. Sometimes, too much text isn’t the issue. Take…

Read More

Choosing a Color Picking Tool

Giant Wes Anderson fan writing you here. So I loved loved loved it when I saw this Wes Anderson Color Palette blog. It’s like several of my happy worlds colliding into rainbows and unicorns. The blogger pulls color palettes from scenes in various Wes Anderson movies. This screenshot is…

Read More

Easy Bullet Charts in Excel

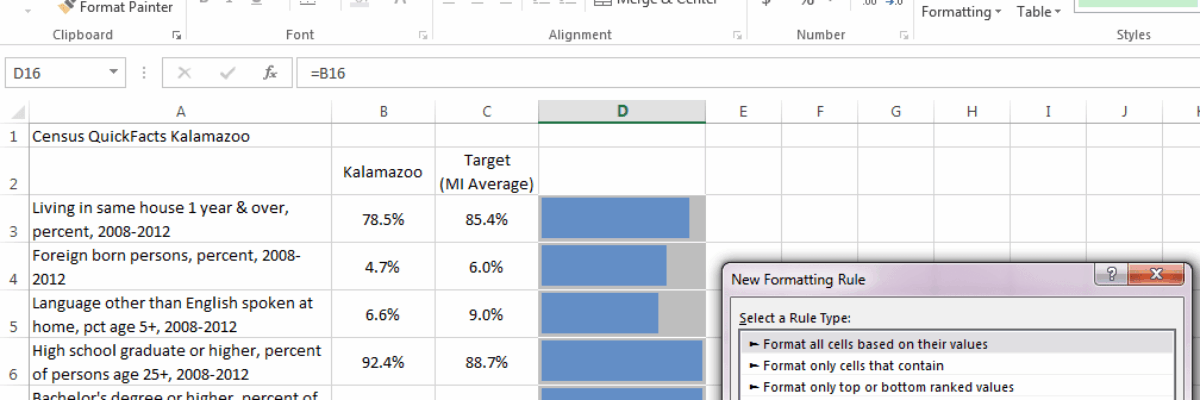
Here is what a normal bullet chart looks like: There are usually areas of performance in the background (acceptable/unacceptable, in this case), a target line, and an actual bar the represents your real value. Bullet charts kick ass for showing part-to-whole relationships for single data points,…

Read More

Largest Photo Service Gives Images Away for “Free”

Last month the world’s largest photo service announced that it would be giving away it’s photos for free. Say what?? Well, it was something like that. Get excited, but not too much. Getty Images announced that a portion of its gigantic, high-quality collection would be available at no cost. Sounds…

Read More

Adding Standard Deviation to a Dataviz

Do you need to communicate your standard deviations to your audience? No, I mean, really DO YOU? Think hard about that because chances are your audience doesn’t give a crap. They want to know you calculated your standard deviations. They want to know you were meticulous in your number crunching.

Read More

Boil the Lobster Font

I swear to god, I loved this font in early 2013 and now it is everywhere and I want it to die. The Lobster font is/was wicked cute. It’s got personality. It’s friendly. It reminds me of Pinterest. But that’s the thing about fonts – their personality speaks for whatever…

Read More

Findings Cookies

If food can get people to meetings, maybe it can get people interested in evaluation findings, too. Introducing, the Findings Cookie. The recipe is pretty straightforward, though you’ll want to adjust the number of servings for your audience. I messed up a lot on the first several, so…

Read More

Data Nerd Valentine’s Cards

Is your sweetheart a little on the data nerd side? I mean, aren’t we all? Here’s the perfect way to show your honey how much you appreciate him or her – even when buried in a statistics book. Data Nerd Valentine’s Cards. Like my Data…

Read More