
My 2018 Personal Annual Report
This is my last personal annual report. I’ll tell you why.
This year most of my metrics went down. At first, due to cultural conditioning that says “more is always better,” I was like Oh no!
Before I go further, let’s pause and break that down. I’ve been creating personal annual reports since 2011 and I’ve chugged along merrily without questioning my metrics, my assumptions, or my goals because all metrics increased every year. This is the first time I’ve stopped to rethink this whole thing. That’s so stupid.
Is More Always Better? Heck no. And I see this logical fallacy take place with so many organizations I consult, too.
Then I started to think about why some metrics decreased. Yes, this is the first time I asked Why? Previously I had just assumed that things increase because I work hard and I’m awesome. Did that change? Was I less awesome in 2018?
Welp, upon exploration, it looks like one of our automated metrics trackers started glitching out a few months ago and needed a reinstall that I didn’t even notice until I started pulling data for this annual report. Dang. That not only impacts this year (especially if we are only looking at top-line improve/get worse judgments), it throws a mess at my ability to compare in future years. This, too, happens with the companies I consult.
I also flew fewer miles last year. Is this really a bad thing? Ever travel at the end of the year and when the gate agent calls the Gilded Elite Status to board, it’s 100 very tired looking old white men? I don’t want to be that. So how many miles flown is “good”? How many do I want to fly? What’s my sweet spot? Or is this even the metric I should be tracking? Should I chuck this whole business out the window?
Yeah, I spiraled a little.
But these are the questions we *should* be asking.
What are the right metrics?
What does success on that metric look like?
The smart organizations I work with are asking these questions, too.
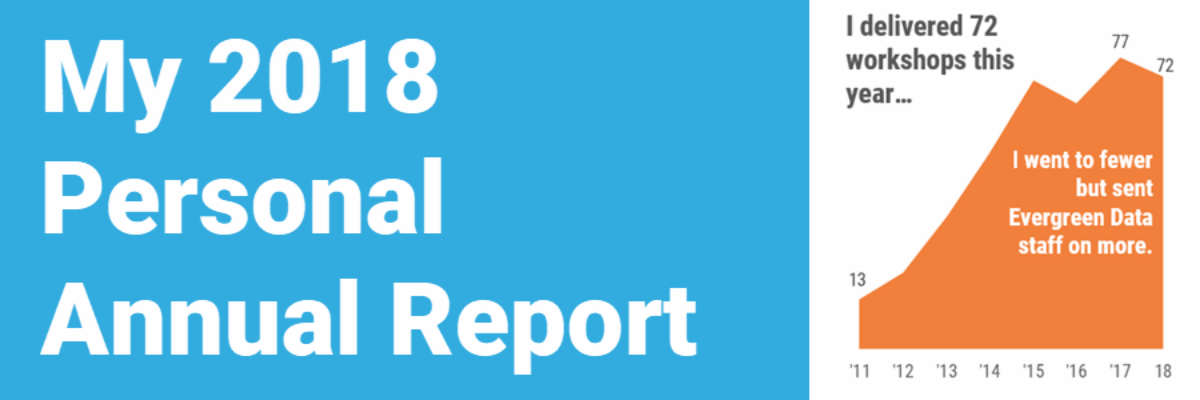
For example, I gave slightly fewer workshops in 2018 than in 2017. Is that bad? Not at all! I sent my staff to lead my workshops, and that’s awesome!
And for that reason, I recognized that this is the end of my personal annual report. Because business activities at Evergreen Data are no longer completely personal. I have a team of 6, who’s activities haven’t ever been counted here and leaving that out is not a true reflection of what I have built.
Of course some metrics did continue to climb, such as our Data Visualization Academy enrollment, how much I published, and how many water bottles I didn’t throw away.
And even most of those will have a natural cresting off point, after which more growth is not sustainable.
Whew, what a fun and necessary reflection! I spent much of this season ruminating, so you’ll notice that the design of the report hasn’t changed much since last year. Still, as always, you can download a click-able PDF.
I’m thinking carefully of what successful business metrics look like here at Evergreen Data and how I can turn what started out as a fun annual project into something more serious about how we measure ourselves.
Til next year.
