Evergreen Collections
The end of August marks an important moment for me because it is when I quit my salaried job to work on data visualization and design full time. 5 years! It remains one of my best decisions. So, I like to celebrate it with you.
Last year, I launched the Evergreen Data Visualization Academy. Enrollment will open again in the next couple of months, so you might want to get on the waiting list.
This year, I’m giving you Evergreen Collections.
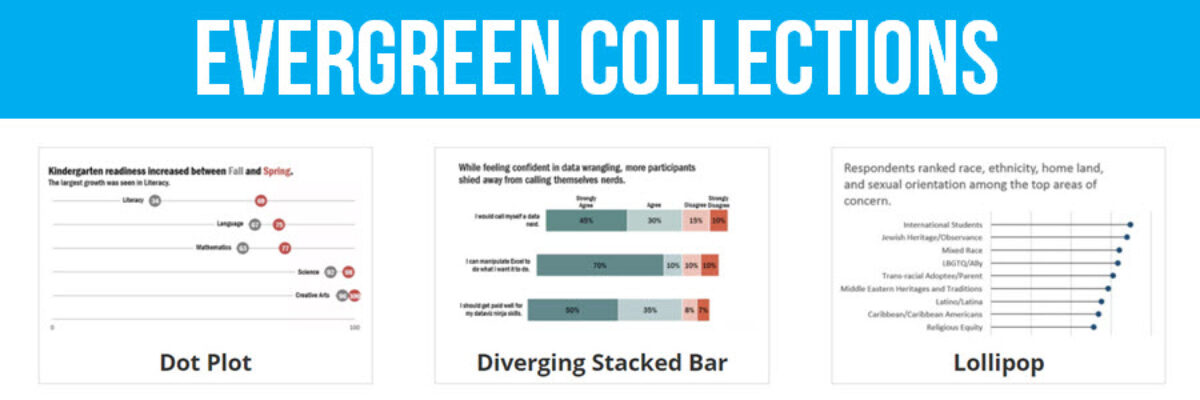
On this page, you’ll find a collection of all of the blog posts I’ve ever written that are step-by-step guides on how to make data visualizations in Excel. These rolled over, with lots of other content, into one of my books, Effective Data Visualization. I have 14 tutorials in that collection right now and it’ll grow over time.
On this page, I’ve collected our resources on qualitative data visualization. The Qualitative Chart Chooser is also there and you can expect new additions every quarter.
On this page, have a blast with your data using ideas from my Fun and Games Collection.
On this page, you can snag one of my super helpful handouts or download a template.
My blog has been a labor of love and I hope you are able to use the resources I’ve developed over the years and collected here to grow your visualization and communication skills. Let’s keep on going together.?


