
So COVID Interrupted Your Data Collection…
Kristi is a researcher in the Truman School of Public Policy and a rockstar member of my Data Visualization Academy. She was working on a study of an after school sexual health program when COVID happened, knocking her data collection strategy to its knees and leaving her without much to report about even the short term metrics of the program. Which is what she was hired to do.
Kristi came to our monthly Academy Office Hours meeting asking “Now what do I do?” and yall, let me tell you, I think a lot of us are wondering the same thing right now.
Here’s what I told Kristi during Office Hours. You have four possible ways to handle interrupted data collection while still constructing some meaning from the data you do have.
Add Comparison Points
Everyone is under the same umbrella right now, which means their partial data collection can serve as a point of reference for you. Add some comparison groups to your own data to produce a fuller, more meaningful story.

This option is possible if you and your comparison groups have fairly regular data collection. If everyone is experiencing a partial year of data, those partial data points are still comparable.
Perhaps you don’t have regional sister organizations or a national average… but do you have similar organizations in your same space? While folks are traditionally reluctant to share program performance data between organizations, we are now all in the same boat, trying to make sense of the data that we have. Who else in town was running after school programs aimed at your same age group? Use this as an opportunity to construct a new, more cooperative relationship.
Add History
Fingers crossed, you’ve been in business longer than just this year. If so, you should have some historical data you can add to the picture.

When you can, cut last year’s data at the same point in the year as when pandemic hit, so that you are comparing apples to apples. And include those comparison groups, if you have them.
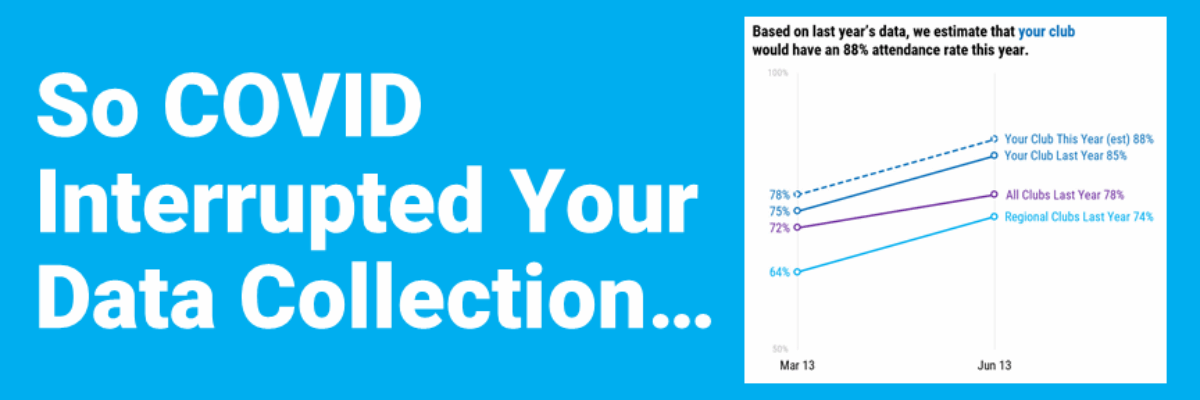
Estimate from Imputed Data
So far my suggestions leave out actual end of the year data. But you could potentially estimate what your year-end data would have been by looking at growth during the same time frame last year (and even the growth your comparisons had in the same time frame last year).

You’d have a hefty caveat of “if things stayed just as they were last year…” which, let’s be honest, is a big IF. But that’s ok. We’ve got to make the best of what we have to work with right now. If anyone should give you any flack about this, you are dealing with a jerk.
Say It Loud and Clear
If you have no good comparison groups, no solid historical data, and nothing to estimate from, you can’t draw much of a conclusion about what happened with your group this year using the data you have collected. But you can say that COVID happened. It interrupted everybody’s everything. So, just say that.
Maybe you can call up a few of the program participants and get some quotes from them about how they miss the program or wish it could move online or how they’ve been so busy taking care of essential workers in their family that they haven’t thought about the program at all. At this point, that’s going to tell you a lot more about your program than the other half of the data you wish you had.
Kristi’s question is exactly the sort of thing we love to help people work through in the Academy. When you join, you become part of a supportive community full of empathy and ideas that you can tap into as soon as that giant question mark (or exclamation point) pops into your head. You get to pick my brain (and the hundreds of other rockstars) any time AND learn exactly how to make the suggestions we give. This is how you grow.
