Last week a friend told me the story of a well-intentioned nonprofit that designed teaching materials for Native American populations, in which they unintentionally perpetuated inequality. He described one piece that included a picture of the scales of justice. I didn’t get the significance, so he explained that while most white…
Blog
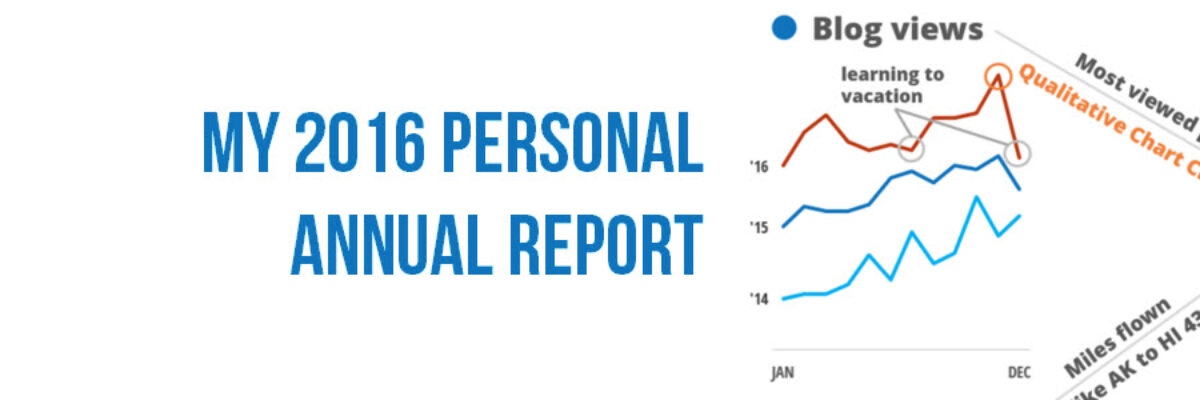
My 2016 Personal Annual Report
Every year I say this has been the best year ever and every year it is true. Daily, I’m grateful for work I love with amazing people. Thanks for being a part of this with me! Since 2011, I’ve been creating a personal annual report. It’s a dashboard of sorts…
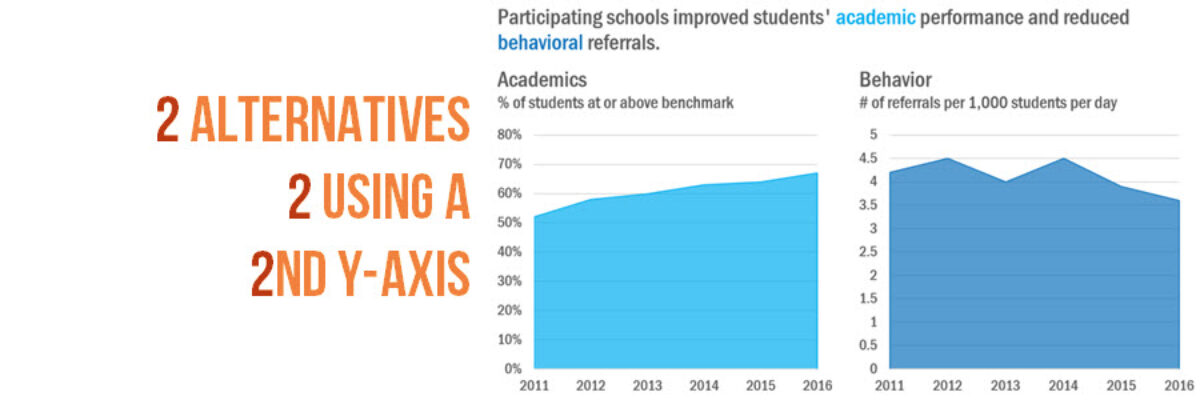
Two Alternatives to Using a Second Y-Axis
Almost as often as I see a pie chart with a hundred tiny slivers, I see line graphs using two y-axes. And it is just as bad. Graphs like this appear in every industry, everywhere I consult all around the globe. Using two y-axes is not a great idea…
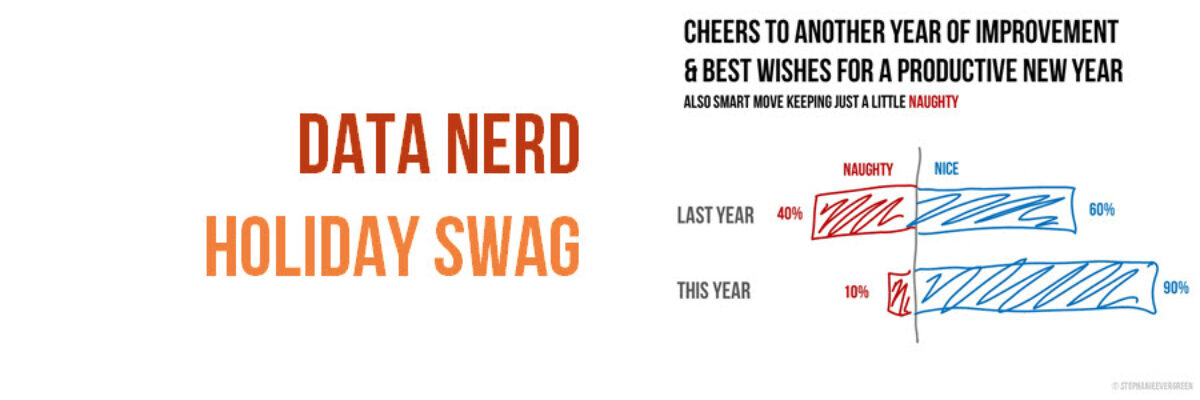
Data Nerd Holiday Swag
One of the smartest branding moves is to keep yourself top-of-mind with clients when you aren’t in the throes of discussing contract details. The new year is a perfect opportunity to remind your clients that you are both fun AND serious about data. I send a holiday card to my…
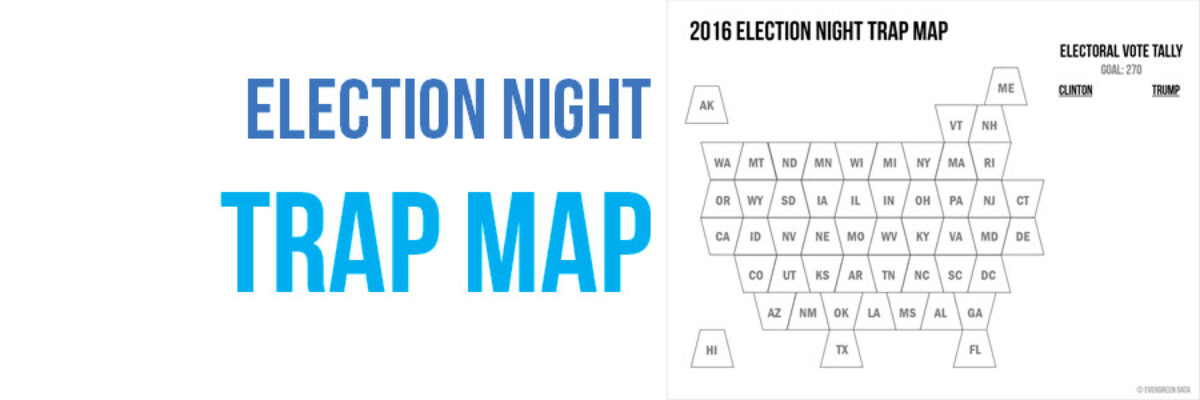
Election Night Trap Map
Since none of us can escape election coverage, no doubt you’ve seen voter and poll data displayed on some unusual maps. 538 is showing electoral votes as a hex map (made up of hexagons) and the Wall Street Journal did the same as a tile map (made up…
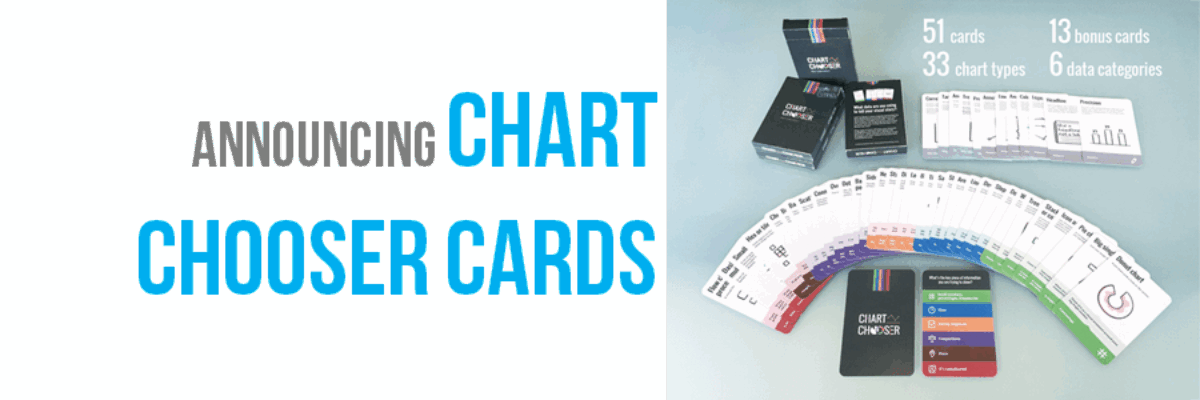
Announcing Chart Chooser Cards
Update: After a successful Kickstarter campaign where we raised over 1,000% of our goal, the cards are in production and you can now order a deck, an infographic, and our templates from our permanent website. Thanks for your support, lovely people. Chart Chooser cards are simple and easy…
Strong Titles Are The Biggest Bang for Your Buck
If you do nothing else to improve a weak visualization, you’ll still seriously improve its interpretability by giving it an awesome title. Generally we use weak titles that don’t really tell us the point of the visualization: I think this is because we make our graphs in Excel,…
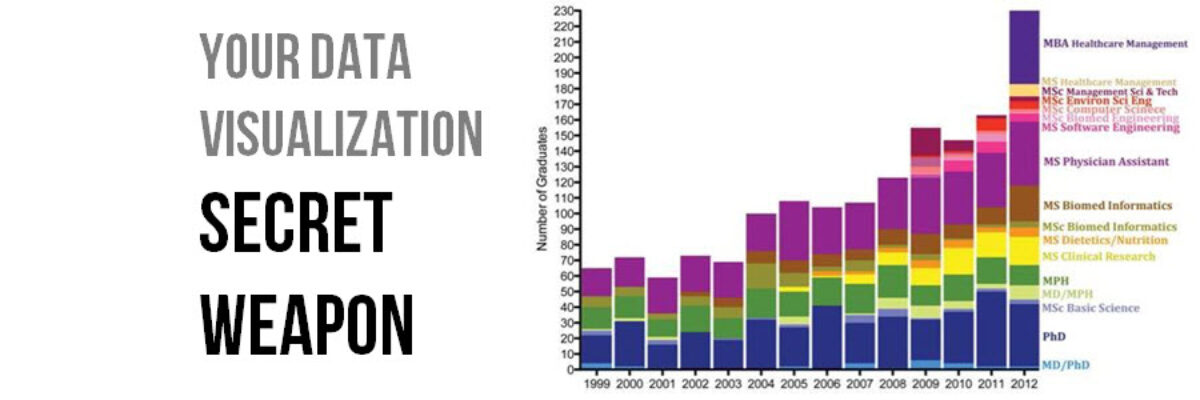
Your Data Visualization Secret Weapon
You want to know the trick to fixing most scary data visualizations? The answer to horrifying stuff like this? What does one do when the graph gives you the shivers? http://viz.wtf/post/142740495532/spaghetti-sans-meatball The answer is always going to be:…
Evergreen Data Visualization Academy
The Data Visualization Academy is only open for enrollment twice a year. Come get select access to my best data visualization tutorials and advice. Four years ago today, I took the leap from salaried employee to independent consultant. Since then, I’ve worked with scores of organizations to help them use…
Make It A Game
I spend a lot of time talking about really serious data with incredibly focused people. I love them and I love my job. But sometimes I need to balance that out with some Lucky Charms. So while eating my bowlful of magically delicious sugar bombs the other day and looking at…

