The Year of Data Visualization and Reporting
On the plane, heading back from the American Evaluation Association’s annual conference in Anaheim. Long plane rides such a great opportunity for reflection. What’s on my mind? The overwhelming success of the Data Visualization and Reporting Topical Interest Group. We had so much support in getting this group launched and we were so embraced by the rest of the conference attendees. Highlights:
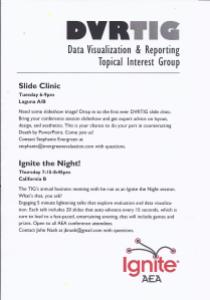
1. Slide Clinic – The night before the regular sessions began, we held an open clinic where attendees could bring their conference session slideshows for some quick diagnosis and triage. I recall a few years back, when I sat through a workshop given by someone who attended the clinic. Helping her choose legible fonts – improving her communication of her otherwise very insightful charts – was damned rewarding.
2. Ignite the Night – We held our required annual business meeting as an Ignite session. You know about Ignite, yes? Fast-paced, 5-minute talks where the slides auto-advance every 15 seconds, whether or not the speaker is ready. Never has that much fun been had without alcohol at a TIG business meeting, I’m sure of it. Video will be posted soon.
3. Data Visualization and Reporting-sponsored Conference Sessions – Audience size at our sponsored sessions was a clear indication that evaluators are becoming increasingly interested in good communication and reporting. We had the good problem of overcrowded rooms at all of our sessions – beyond standing room only, sitting on any open floor spot, spilling out into the hallway. For our first presence at the conference, we sure made ourselves known.
As founding chair of the TIG, I stepped aside after our business meeting, turning things over to the new chair, Amy Germuth. This year’s total rock star debut will keep feeding my soul until next year, people, in Minneapolis.

