Visuals for the Methods Section

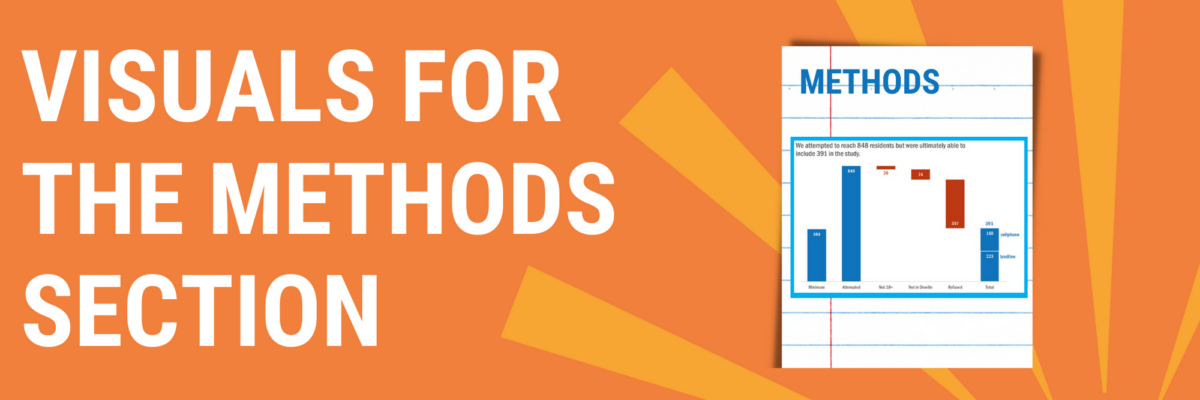
You can tell when someone is getting their data viz eye well-honed because they start asking where ELSE can I include visuals that will better explain my work? That’s Sue. She had grown comfortable with high-impact, story-telling charts in the Results section of her reporting but…

Read More

Add Labels ON Your Bars

Meg, an Academy student, sent me a great question for our monthly Office Hours call: How do I replicate this? Pretty cool chart, right? It comes from Global Web Index, who put out tons of relevant data in interesting graphs.

Read More

Graphic Designers Need To Learn Data Viz

I am a data nerd. I grew up, professionally speaking, designing studies, collecting data, and trying to get people to make use of the analysis and results. After I married a graphic designer, I realized that no one was going to pay attention to my amazing, glorious, wonderful data if my…

Read More

How To Teach People Data Visualization

Have you ever accidentally taken one step too far down the internet rabbit hole? This has happened to me more than once when I’m trying to google the solution to why my chart isn’t working. I click into a Q & A forum that teases the answer – but the…

Read More

Will Amazon Lift Their Ban on PowerPoint?

When Jeff Bezos said in his 2018 annual letter to stakeholders, “We don’t do PowerPoint,” you could almost hear the stock price of Microsoft sliding downward. Presentation designers around the world started looking for second jobs. CEOs in other organizations started to follow suit, because whatever Bezos does is…

Read More

Marry Your Graph

Here’s the thing: Your graph isn’t ever just going to chill out in your Excel file or Tableau worksheet. It’s going to live a life elsewhere, like in a dashboard, a slide, or a webpage. So when we make our graphs, we have to think about their future home environment.

Read More

Online Courses

Everyone can make great graphs. You don’t need a degree in computer science (and a minor in graphic design) to make charts that knock socks off. You don’t need to spend your already limited budget to outsource your graphs year after year. You can do it yourself…

Read More

Chart Starter Series

Chart Starter Series Gotta make simple, clear, easy-to-understand graphs but intimidated by the software?Kickstart your charts with the Chart Starter Series. Enroll Now! Graphing software can feel mystifying and user-UNfriendly.  But you can use the tools you have to make compelling…

Read More

Academy

If you believe data is powerful –as long as you can figure out how to communicate it effectively… Join the Data Visualization Academy. GET ON THE VIP LIST People who communicate data effectively change hearts and minds. They win recognition and…

Read More