Buy from SAGE Buy on Amazon or my local bookstore Effective Data Visualization The Right Chart for the…
Books
Read More

Buy from SAGE Buy on Amazon or my local bookstore Effective Data Visualization The Right Chart for the…
I’m taking my normal in-person speaking engagements online and you can come. I’ll be presenting one 90-minute class per month and repeating this entire series every 4 months. You’ll even get a sneak peek of examples from my forthcoming book (don’t tell Sage). Here is the lineup: Reporting to be…
Let’s give the audience a peek behind our mental curtain. We want to make our logical organization of our data very very clear because what makes sense to us (who have been so steeped in the data we’re dreaming about it) will not be readily obvious to an outside viewer…
There’s a PowerPoint handout buried in the back of your filing cabinet that you are never going to look at again. You know I’m right. Here’s the thing: Your data is gathering dust in someone else’s filing cabinet, too. Bad graphs get ditched or deleted because they confuse…
Dealing with potential audience colorblindness isn’t as mysterious as it seems. (And as an added bonus, by way of handling colorblindness, you’ll also fortify your work against the dim bulb in the projector or the color settings on the presenter laptop that skew your established color scheme.) One product,…
In my dissertation study (probably the most boring four words to start any blog post), I saw a lot of evaluation reports that grouped all tables and graphs into the appendix. Tables, graphs, and other graphics really must be placed right next to the narrative describing them. Why? When we…
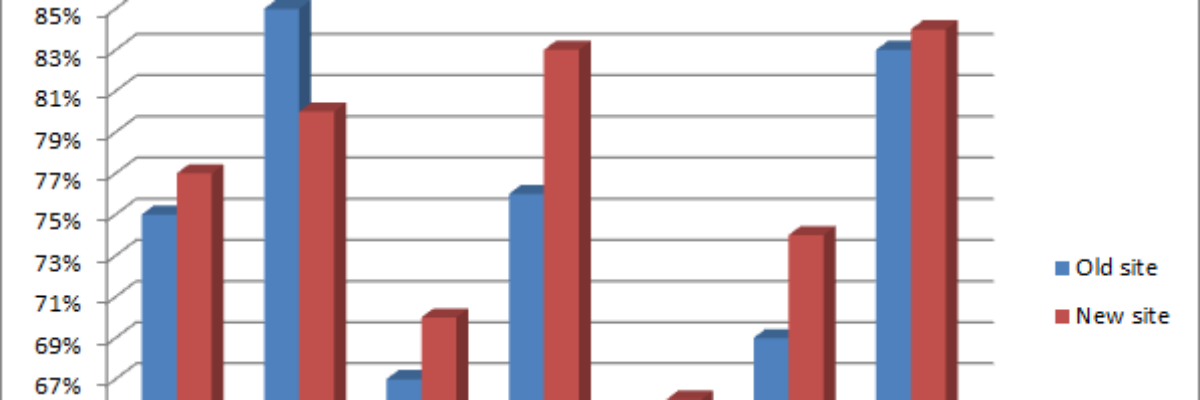
When giving advice about chart styles, one of my friends likes to say “save 3D for the movies.” She’s right – research shows that 3D charts actually slow reader comprehension. I’ve long advocated for the use of ChartTamer as a friendly way to restrict data visualization to that which will…
Here’s a procedure I use all the time to help me select color combinations for my reporting. It makes use of this great, free, online program that takes all the scientific color theory stuff and translates it for those of us without a MFA. First, I head to my client’s…
Zach Gemignani, of Juice Analytics fame, gave the keynote at the AEA/CDC Summer Institute yesterday. I had followed their 30 Days to Context Connection list earlier last year, so I was super excited to witness the fun in person. His keynote speech focused on the 10…