Let me add three new qualitative data visualization ideas to your library: Placement Maps, Timeline Ticks, and Sliders.
Qualitative Street Data Visualization
Read More
Let me add three new qualitative data visualization ideas to your library: Placement Maps, Timeline Ticks, and Sliders.
What’s the best chart type? 👆 This is one of those questions where you could ask 10 people and get 10 different answers. The wisest in the crowd will shrug and say “it depends.” Isn’t that frustrating?? Your job would be so much easier if you…
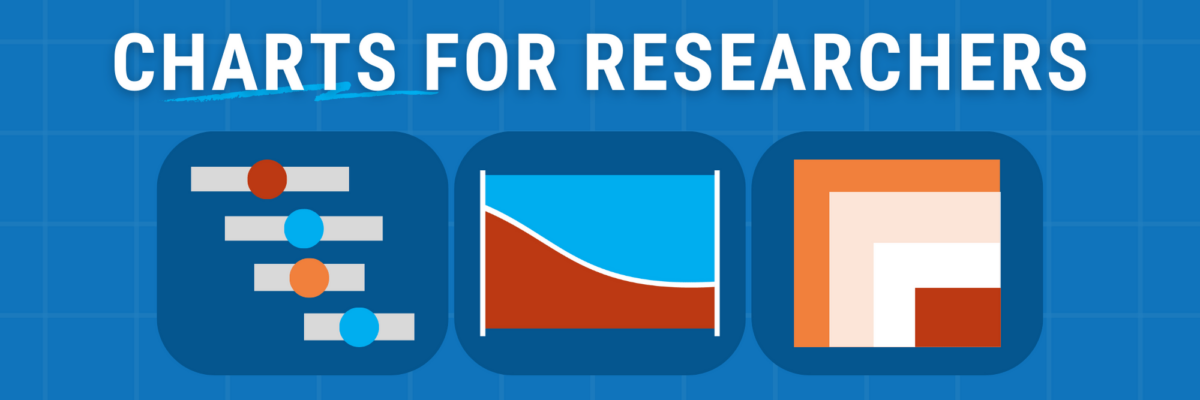
Of course your chart arsenal includes your trusty bars & scatters. Add these 3 to your mix to gain clarity, get more eyeballs, be better understood.
The most common question I get in my work, by far THE top question, is What software did you use to make that?
The myth: Your job is to design a great study, analyze the data, and then share it. Preferably in a journal article. That others will have to pay to access.
Tell me if this sounds familiar. Back when I was at the university, doing research full time, we’d produce reports where the front contained all our quantitative results and the back held our qualitative findings. We coulda been talking about the same themes in both sections but it was up…
Hiring consultants to conduct studies can be an excellent means of turning problems into gold, your problems into their gold.– Martin Marietta Cheeky, Martin. But there’s some truth to that – consultants are expensive. In 99.98% of my consulting projects, my clients get so much value that…
I got you Rockstar! The Data Visualization Checklist is making its way to your inbox right now, elbowing through spam and political donation emails. I’m also gonna send you my newsletter. It’s full of free resources and easy-to-implement tips you can apply to your graphs right away. People freakin love…
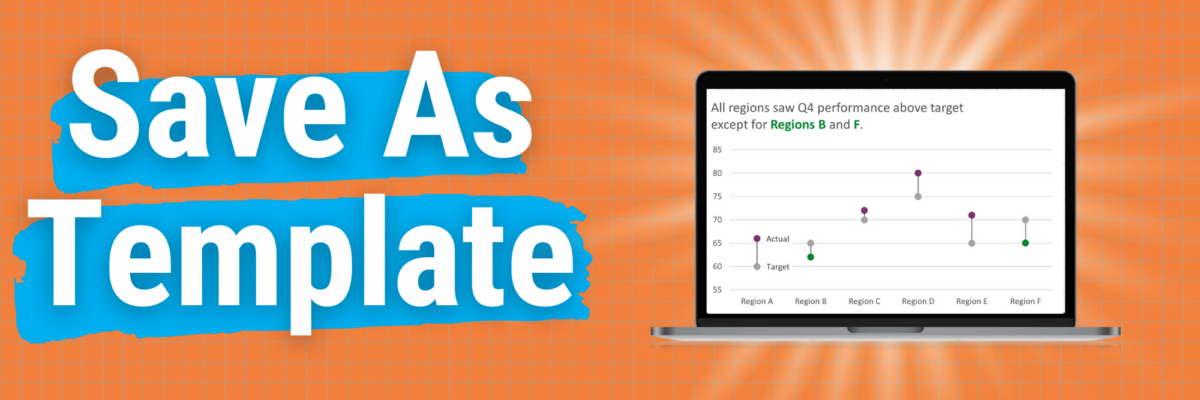
This is my A+ #1 100% best time-saving hack for making graphs in Excel. When you go through the process of making that one graph that’s totally perfect, you can save it as a template so it becomes, essentially, your new default graph. Here’s how. Right-click somewhere in…
Evergreen Data is seeking a specialist in data visualization using R, who has experience teaching or coaching others. This person will be responsible for: Editing existing written R tutorials to add clarity and/or modernize the lesson for the latest R updates Developing screen-capture video tutorials based on scripts written (and…