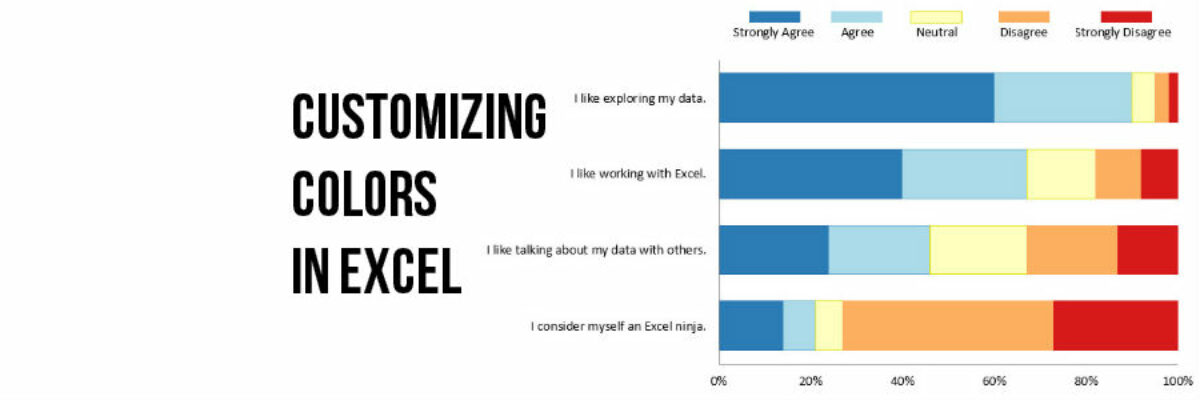
Few things scream “I didn’t try very hard” more than using the Excel default color schemes. Good news is that changing them up isn’t really very hard at all. First, decide what other colors you would like. Maybe pick something from your organizational brand. I used ColorBrewer to come…
Search results for: excel
Directly Labeling in Excel
It’s time to ditch the legend. You know – the legend, the key, the thing to the right of the graph that tells the reader what each piece of your graph means. We don’t need it. Legends are actually hard for many people to work with because they put a…
The Easiest Way to Make Bullet Charts in Excel
There are lots of ways to make bullet charts, some easier than others, some better suited for specific visualization contexts. Hell, there are plug-ins you can purchase that make it a snap. Except when my plug-in broke and I had to remake about a…
How to Make Horizontal Dumbbell Dot Plots in Excel
In case it wasn’t clear, I freakin love dot plots. They are amazingly easy to read, beautifully simple in their display. I was making these babies for some clients a little while ago, before and after dots for about 25 variables in one graph.
Easy Bullet Charts in Excel
Here is what a normal bullet chart looks like: There are usually areas of performance in the background (acceptable/unacceptable, in this case), a target line, and an actual bar the represents your real value. Bullet charts kick ass for showing part-to-whole relationships for single data points,…
How to Make a Diverging Stacked Bar Chart in Excel
Last week my friend Ann Emery posted a dataviz challenge on something I’d been wanting to figure out for a long time: how to make a diverging stacked bar chart in Excel (I’d also heard of them as sliding bar charts, but getting our dataviz terminology on the same…
Dashboard Icons in Excel
We don’t just report the facts, ma’am. We use a set of values to make judgments about the data, like which of these results is good or needs improvement, etc. We set benchmarks and cut points so our clients can understand when action needs to be taken and where. Yet…
Easy Dot Plots in Excel
A while ago I was at a Naomi Robbins’ workshop and she was pretty emphatic that dot plots are the better method of visualization, as compared to bar charts. The reason goes back to Cleveland’s early experiments on visual perception, which found that humans most accurately interpret locations on line,…
Making Back-to-Back Graphs in Excel
Let’s say we’re interested in comparing how two groups – oh, teachers and principals – responded to a survey. One way to visually display that comparison would be a bar graph, where each question had two bars, one for teachers and one for principals. It’s helpful in some ways, but…
Graphing Qualitative Data
Announcing my new chart chooser with 22 qualitative data visualization options.