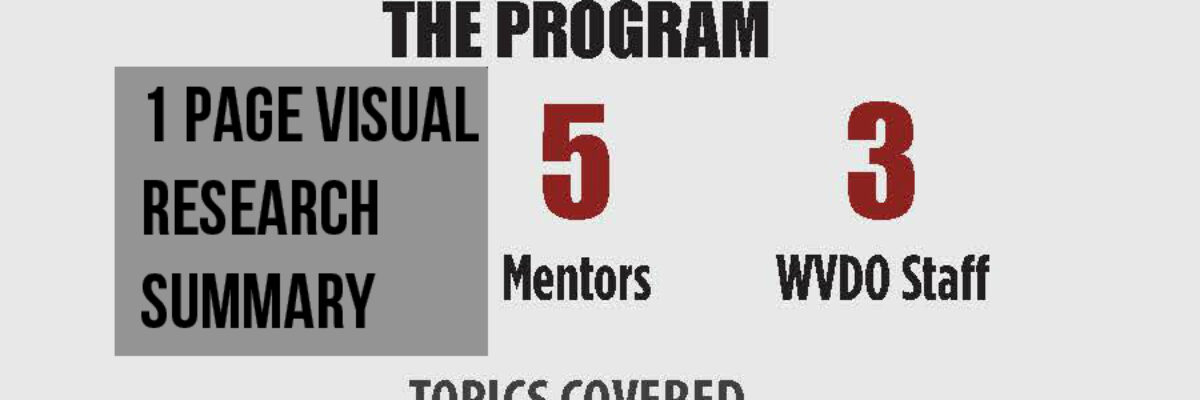
Guest Post: Chari Smith with a 1 Page Research Summary
Stephanie’s Note: Readers are always asking me for more examples of a 1 page research or executive summary and Chari Smith of CRSmith Consulting has a really nice one here that is visual and yet doesn’t involve a single graph!
I have a long history of working with the Willamette Valley Development Office [Stephanie’s Note: Sounds dreamy.] , but their Executive Leadership Academy was a new program and they needed my help assessing whether the program was working. I collected data about program performance from multiple sources, and then met with them where we discussed what was working, what wasn’t, and what program changes would be made based on the data.
Originally, we weren’t going to do any kind of formal written report. WVDO is very evaluation savvy and our discussion of the data seemed sufficient.
But in fall 2014, when we met to close the project, Agnes Zach, Executive Director, did say she’d like something to share with sponsors and potential funders. Something that highlighted the positive impact the program had on participants.
I felt a bit conflicted.
Basically, this would mean synthesizing findings into a marketing piece. Can evaluation and marketing co-exist?
Yes. In this case, yes they can.
They already used the data to improve their program. If they need something specifically highlighting positive findings, and I can do that, why not?
I put my marketing background to work (yes, 15 years ago, I was in marketing. Don’t hold it against me). I sketched the design concept, using the data visualization principles that Stephanie shares in her workshops. One example in her book that really helped clarify the process was the “First Sound Fluency” graph. She took a muddled graph sent home by the school and transformed it into a clear one. It was easy to understand the concepts being measured.
That’s what I wanted the WVDO Program Impact report to communicate. It was a very successful program. I wanted to use the numbers and stories to illustrate the program’s success as well as outline the program components.
Here’s what I produced for WVDO – just one page, front and back:
WVDO used the report in multiple ways:
- Shared it with the participants to see if it resonated with how they felt about the program and their role in growing into potential Executive Directors
- Shared it with current sponsors and potential sponsors as a way to reflect their investment. They also gave the current sponsor a copy to use as they needed to within the organization to continue support.
- Shared it with our board/Community Advisory Board to discuss impact. This was big because WVDO almost didn’t do the program this year. One of the reasons WVDO went ahead with a smaller cohort was this report.
- They are publishing a mini-annual report for members highlighting 2014. This report will be an attachment to that online annual report.
Agnes Zach, Executive Director, had this to say, “Sometimes I struggle with how WVDO has an impact in the community and how we tell our members, supporters and individuals interested in having a bigger impact on their community exactly how we do that. This report has been great in bridging that communication barrier.”
WVDO has used the report to help them communicate their program structure and impact more effectively – in just two pages!
Stephanie’s Note: Nice application of design principles to talk about data, Chari! If you’re out in Oregon, catch Chari in person at the Oregon Arts Evaluation Event or as part of the Willamette Valley Development Officers conference.


