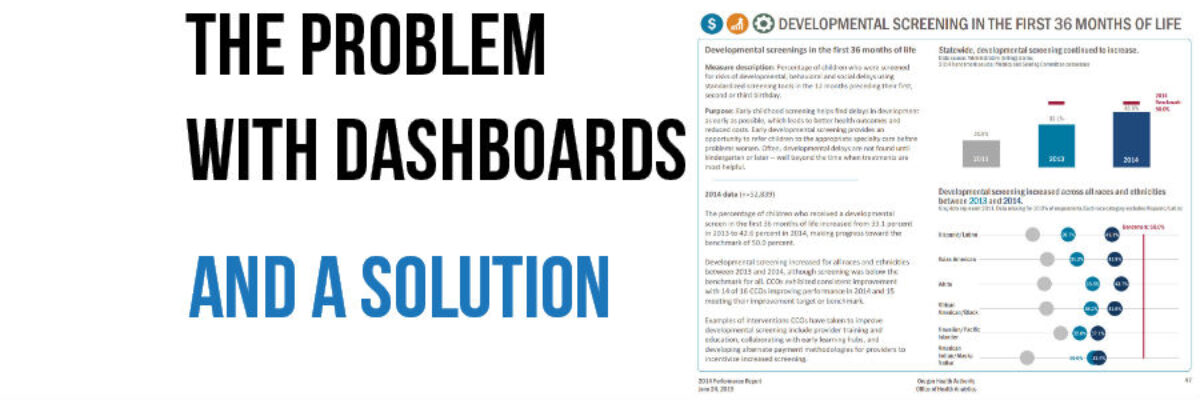
Folks, I’ve been discussing dashboards forever. I’ve consulted with dozens and dozens of clients on dashboards. And through all of that experience, I’ve discovered that dashboards kind of suck. Don’t get me wrong, I understand the need for a succinct complication of performance on key indicators. It sure beats a…
Blog
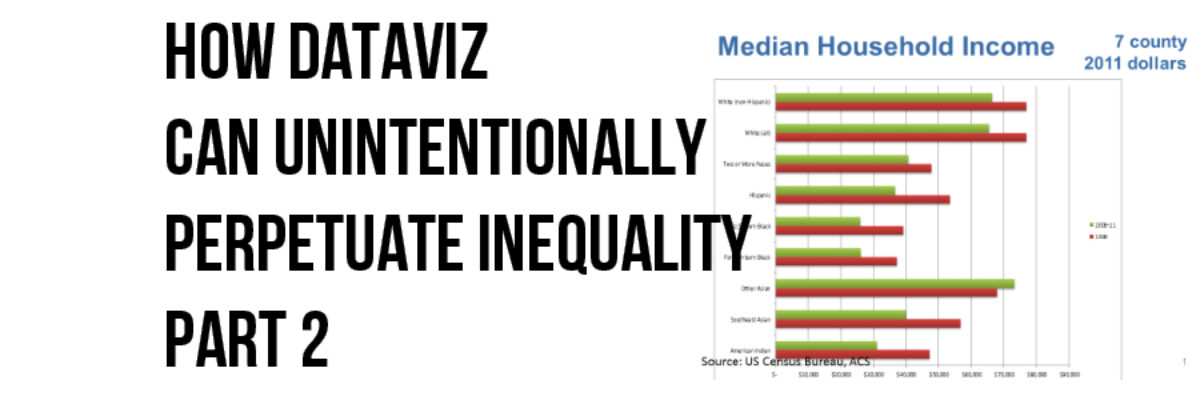
How Dataviz Can Unintentionally Perpetuate Inequality Part 2
Last time Vidhya and I posted on this topic, we addressed how the use of color to visualize individuals can do more harm than good. This time Vidhya joins me again to talk about poverty and opportunity. Organizations in the Minneapolis-St. Paul metropolitan area community identified and started tracking indicators…
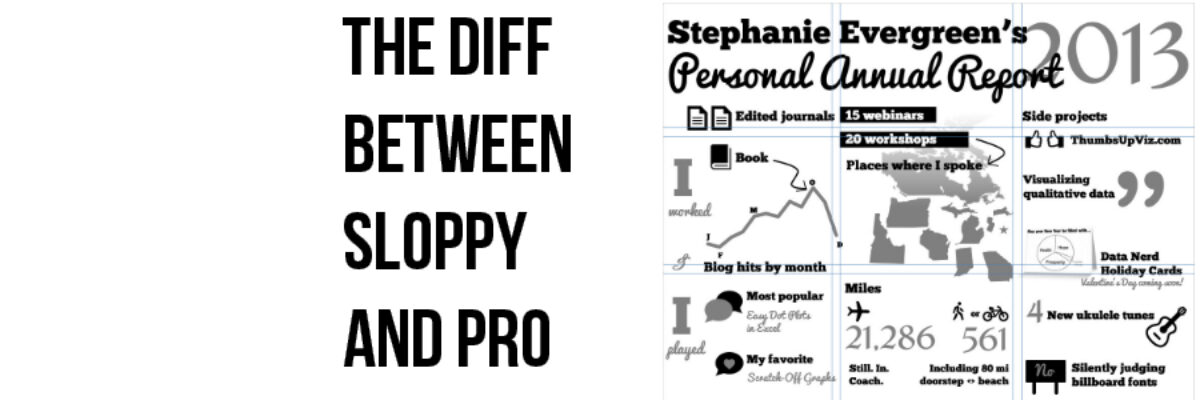
The Difference Between Sloppy and Pro
This is the hardest part of design to get right. It’s what differentiates sloppy, weak design from that which looks tight. It’s the use of a grid. Arrangement matters. It’s the sort of thing that gets talked about in design workshops, but people tend to get so caught up by…
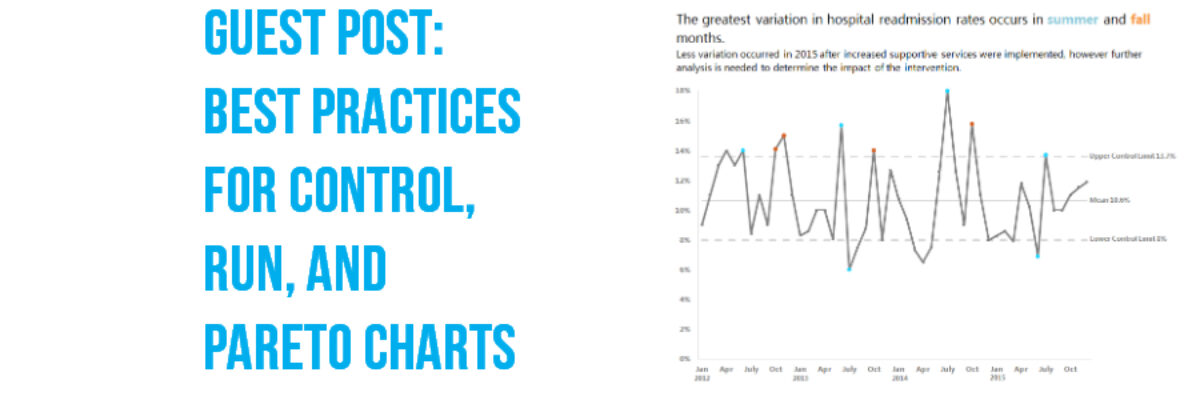
Guest Post: Best Practices for Control, Run, and Pareto Charts
Nicole contacted me with an email subject line: Thank you for the Data Viz Checklist! and she said she’d been using the checklist to overhaul some of her organization’s data visualizations. I’ve invited her here to showcase her before and afters. I’m Nicole Huggett and I recently transitioned…
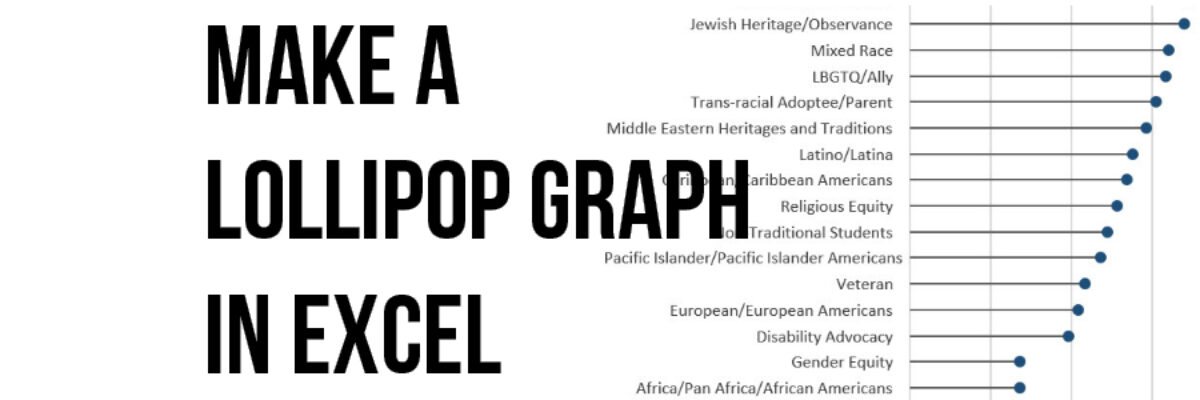
Make A Lollipop Graph in Excel
The simplest way to show many types of data is through a column or bar chart, ordered greatest to least. These will work just fine, most of the time. When do they fall short? Well, when the values are all high, such as in the 80-90% range (out of 100%). Then…
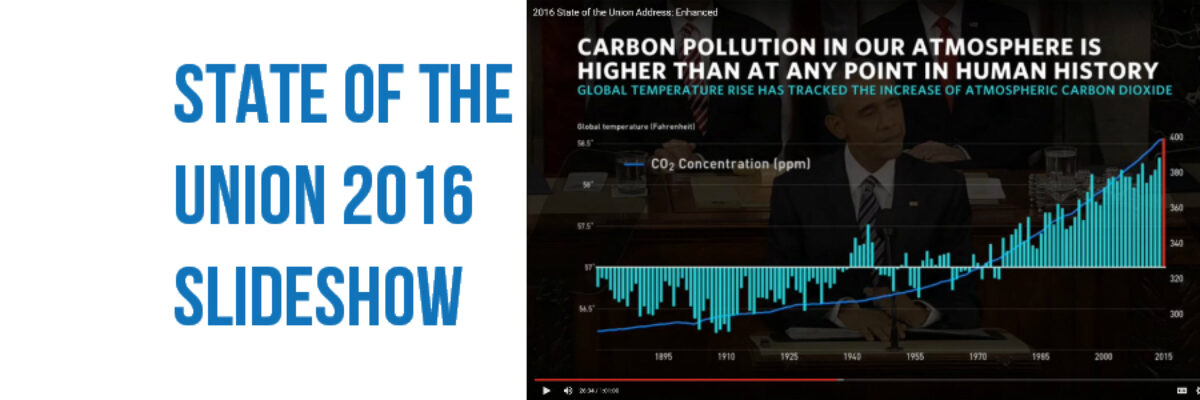
State of the Union 2016 Slideshow
Dudes, the State of the Union is my Superbowl. I look forward to this event like some people anticipate the Oscars. This is my deal. Why? Because the enhanced version of the SOTU features a data-based slideshow, a perfect study in how graphics can help underscore a point. And, as…
Data Viz Challenge Redesigns!
Last week I launched a challenge to redesign financial info from the Gates Foundation annual report. I was looking for entries that made the data more engaging than a table, matched the level of design of the rest of an annual report, and still reported each element originally presented…
Data Viz Challenge: Gates Annual Report Financials Page
So! This was fun. Yesterday I published a post where I pleaded with nonprofits and foundations to add viz to the financials page of their annual report, which is usually just presented as a table of numbers. I shared two redesigns that I made. The one I remade for…
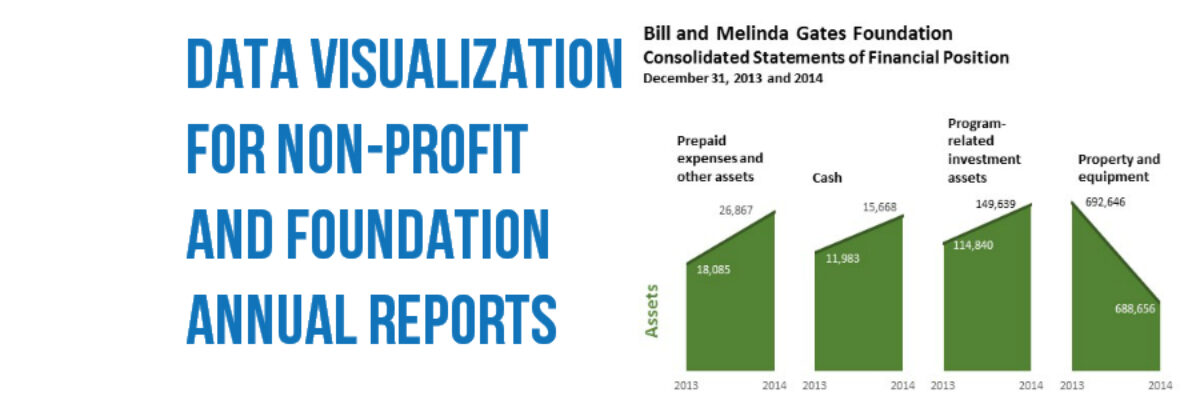
Data Visualization for Non-Profit & Foundation Annual Reports
Annual reports are where non-profits and foundations pull out their designer big guns. This is where they show off their muscles, like studs on the beach. The annual report is the place where an organization oils its accomplishments til they shine. The annual report is so important, most organizations still…
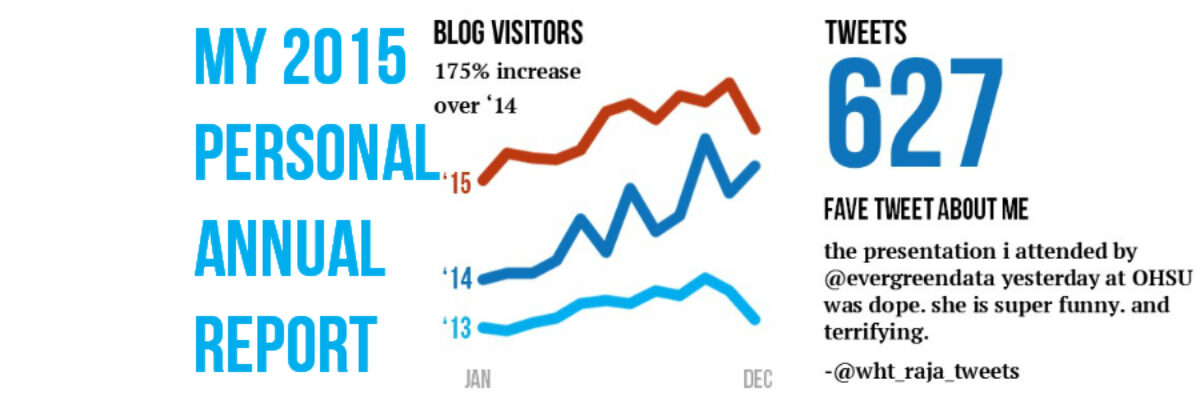
My 2015 Personal Annual Report
Yowza, what a year! And it is only December 2! I’m writing from my hotel room in Boston. This week I’ve been working with Annie E Casey Foundation (Baltimore), Education Development Center (Boston), and the Ad Council (New York City) – and what a set to round out another awesome year…
