
Must Know Qualitative Charts
Qualitative data visualization doesn’t get the same love as quantitative. It can seem like our only option is the good ol word cloud, which my colleague Humphrey Costello famously equated to dog vomit.
But at Evergreen Data we’ve compiled the largest collection of qualitative charts. Wanna learn about my favorites? Adding these visuals to your knowledge bank will give you new ways to tell stories and get people engaged with your data.
The days of quote after quote after quote are gone. I mean, maybe you’re better than me but that’s all we were doing back in the day when I worked on research teams at the university. We were essentially just giving the audience our raw data.
Akin to handing the client a spreadsheet and a “good luck.” Only our raw data was words. Surrounded by more words.
No wonder people didn’t seem to grasp much. No wonder our research didn’t really have an impact.
Now I know better. And you will too.
A visual is going to plant itself into your audience’s minds faster and more effectively than paragraph after paragraph of quotes. You can still keep all the words if you want. You’ll just need to pair them with a graphic for your info to align with how our brains function.
So try on one of my go-to qualitative charts.
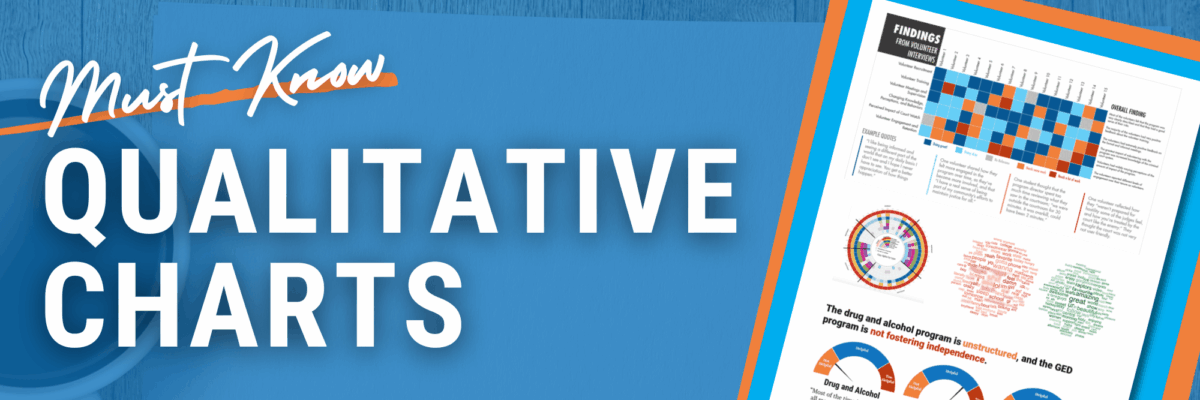
Heat Table
In a qualitative context, a heat maps plots your themes in rows and your study subjects in columns. Or vice versa. Then you color code the intersections according to a structure you develop.
I shared this example in my post on pairing quant and qual together but it’s so effective I’m showing you again.

The researchers we worked with on this project developed a Likert-ish scale, from Doing great! to Needs a lot of work. We assigned colors to those categories and summarized the theme in a sentence on the right.
My friends, this is literally just a table. It’s so easy to make. We used PowerPoint. You can 100% do this.
Spectrum Display
If you want to kick it up a notch from the heat table, navigate your way to a spectrum display. The earliest one I could find was from a journal article published by qualitative researchers who were observing patron behavior on a set of computers that had just been installed in a public library.

The patrons are all listed around the outside of the spectrum. The inner sections are mutually exclusive categories that, in this case, represent how long the patron stayed at the computer. The rings are the themes of the study, which, here, are the goals people had during their computer session.
(Ah how refreshing and charming that the time increments only go up to 30 minutes and the goals don’t say Tik Tok or Tinder.)
The dots simply represent presence of the goal. So, for example, Patron 30 was there under 16 minutes and spent that time looking for jobs.
The encodings can get more complex. Check out this example from the Guardian.

Similar set up – the individual cases are around the outside, though in this instance there are so many cases that it takes up the complete circle. And the sections are mutually exclusive – regions of the US. But the encodings are more complex with shades of color, gray, and even pattern fill.
You can focus in on a single cell or you can step back and look at the big picture. This spectrum lets you see patterns – like marriage rights being federal. And clusters, like how there are a lot of gay rights in the northeast and relatively fewer in the southeast.
Not gonna lie, it’s more complicated to make this than the linear heat table. But it’s also got a level of WOW that a heat table doesn’t have. (We have instructions on making this in the Academy.)
Gauge Chart
Staying circular, I’m a big fan of how gauge charts can help us tell really specific stories. Though these are often derided among quant folks (and those who are close minded…..), they can be so helpful for qualitative research. For a couple reasons.
1 – Quant folks think gauge charts take up an unwelcome amount of space and that, if we just made them linear it would be more efficient. That’s why Stephen Few developed the less-than-gently-named bullet chart.

So much more streamlined, he says. More space-conscious.
But you know what qualitative work desperately needs? Big ass visuals.
2 – Gauge charts help us disrupt existing mental models.
In Few’s bullet example, the story is that things get better as we move from left to right. I mean, that’s the story with most versions of a bar graph. But that doesn’t always match the story we’re trying to tell.
For example, this set of gauges reports on the findings from a survey of inmates who were enrolled in an independence program. The program was designed to teach them tools for living on their own after release.

In a program like that, you wouldn’t want staff being unhelpful – of course. But you also don’t want staff being too helpful, or else you’d take away some of the independence the program is intended to foster. There’s a sweet spot in the middle.
A bullet chart would make it hard to see the sweet spot because the bullet chart is deeply rooted in our existing mental models about left-to-right. But a gauge chart breaks that mental model. The bend can help us mark a sweet spot. Gauge charts tell a specific story.
Comparison Word Clouds
I believe the three ideas above can give you a jumping off point for your next qualitative study.
But if you’re still holding on to your good ol word clouds, let me offer this adjustment: the most insightful word clouds come in pairs. It’s in the comparison that we’re able to construct some meaning.
Take, for example, this comparative word cloud generated from researchers at McMaster University.

Their study examined Twitter posts from Canadians and U.S. Americans. I bet you can tell which word cloud belongs to which group. They blurred out some of the common words that were inappropriate for publication.
It’s in the comparison between the two word clouds that we can see some differences and generate some insights. Word clouds have more storytelling power when we use them in a comparative sense.
Get some ideas?
Cool. I have even more in my new Qualitative Chart Chooser.
I hope you use qualitative charts and that they inspire you to develop even more new ways to showcase our qualitative data. Your research deserves engagement.
