
Use Labels Sparingly
Do you really need to put labels on every single data point? Too much text in a graph clutters it up, making readers feel overwhelmed. It clogs up their ability to make it through your data, like too much traffic on the highway.
Labels in Scatterplots
I love this dataset, even though it’s old. This is how I originally found it in a no-longer-updated resource for teachers, Radical Math.
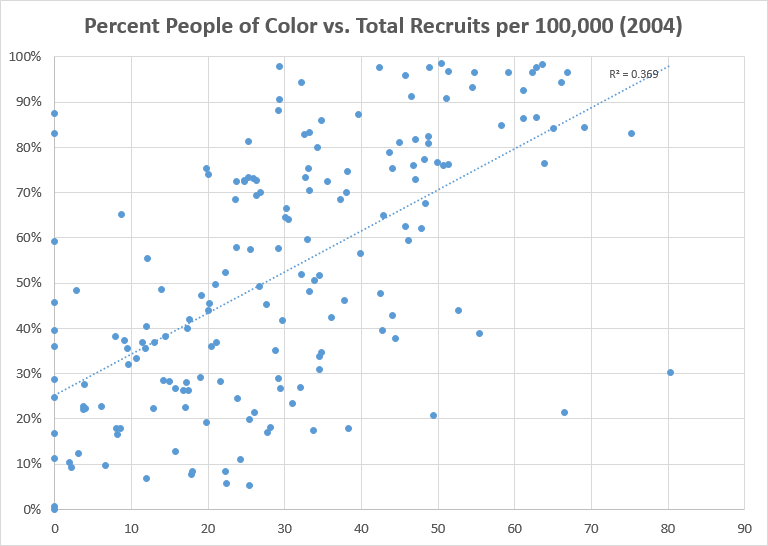
It plots the percent of people of color living in each NYC area against the number of military recruits per 100,000 in those same areas. Interesting in that we can see a trend but it needs MORE text in order to really get the story, right? On the Data Viz Checklist, this would score a 0.
Here is an improvement:

This version would score 1 point. Why?
I decluttered the graph a little by removing every other number from the y-axis (we know what comes between 20% and 40%) and shifting the correlation notation from inside the graph to the subtitle. I also added in axis labels for clarification, better orienting the reader to the data at hand. (I altered the title and subtitle too, which I discuss in another post.)
But we could take this even further, for a full 2 points:

If we labeled every data point in this scatterplot, it would be impossible to read.
But one of the first questions readers will have about the data is which NYC areas are outliers and which are on the trendline. Zero military recruits from Wall Street? Surprise, surprise.
So we can label selected data points – sparingly – to provide some context without overwhelming our audience.
Labels in Line Charts
We see this happen even when the data sets are a bit smaller. Like your old friend, the line chart.
Please don’t label every point along the line.

Yikes, right?
No one, and I’m willing to place a bet on this, cares what the quadrillion British thermal units were for NGPL in 1972. To three decimal places. Nor could they even see it if they did care.
To label this sparingly, I’d think about where the story lies. What would be most interesting to my audience. Likely, the most current time period – add labels there. And perhaps where anything peaked – add labels there.

And let’s reduce the labeling along the x-axis. People know what lies between 1950 and 1955. We could even chop off the first two digits of the years.
Obviously it’s way more readable. But it’s also more approachable. Friendlier. Digestible. The vibe has shifted because we labeled sparingly.
