
My 2012 Personal Annual Report
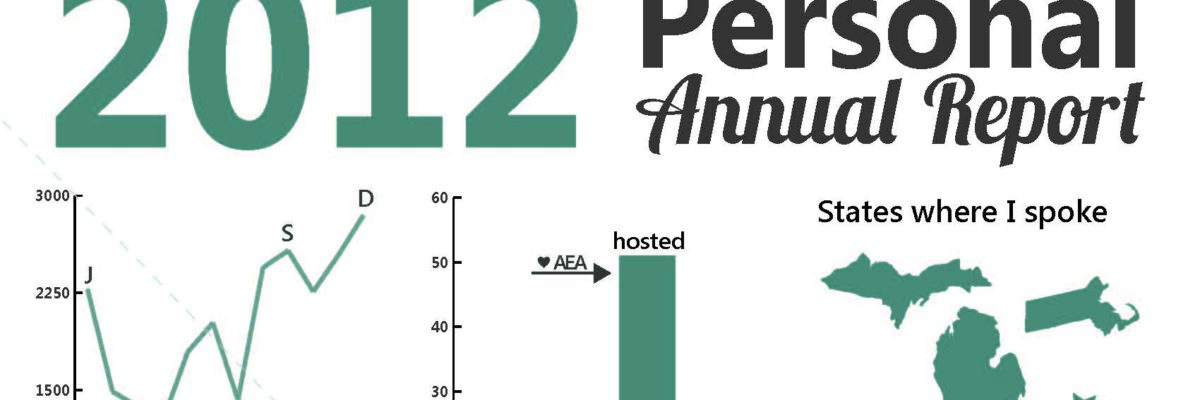
Yeah – It’s that time of year again! Here’s what I’ve been up to.

Imagine if we could convince more clients to let us produce evaluation report summaries in this dashboard-esque format.
Side note: I deviated from my normal routine and made this report in Illustrator, which I learned while taking Alberto Cairo’s MOOC on infographics in October & November 2012. While I think the basic Microsoft suite, which I used for last year’s report, works perfectly well for most purposes I realized what Illustrator could do: produce this report as a vector image. If you don’t already know, vector images can be infinitely resized without losing their crispness and detail. No fuzzy pixels when expanding the graphic! And throughout my 2012 workshops, I often put my annual report, or portions of it, on a big projected screen for discussion. And it was a bit fuzzy! So I used Illustrator for this annual report because I knew I’d want to dramatically increase the size during 2013. I remain extremely committed to the idea of making Excel and Word do your bidding, but there’s a time and a place for bending my own rules, eh?
