I rewrote this post 4 times, in an effort to give it a calm and professional tone. And then I thought “Ah fuck it, this is my blog and I can say whatever I want.” I’m writing this post because I just listened to an interview about data visualization. It…
Search results for: excel
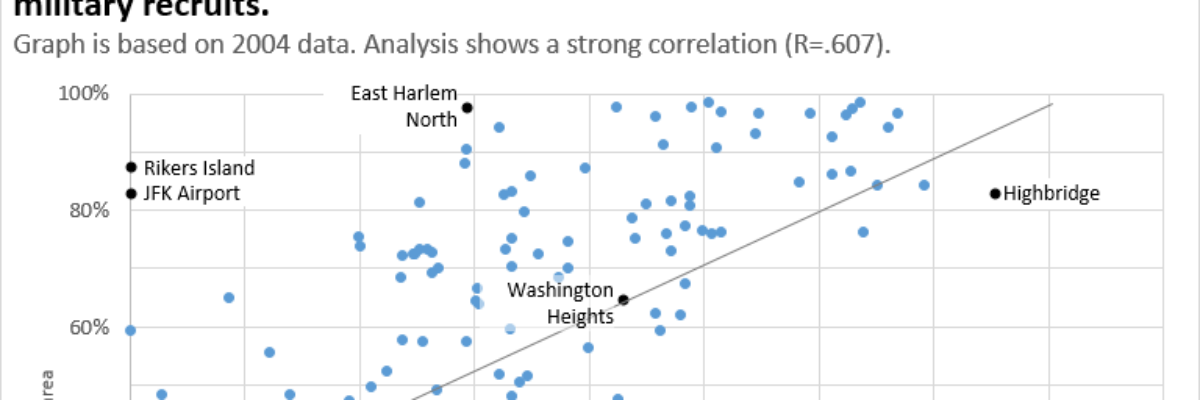
Labels are Used Sparingly
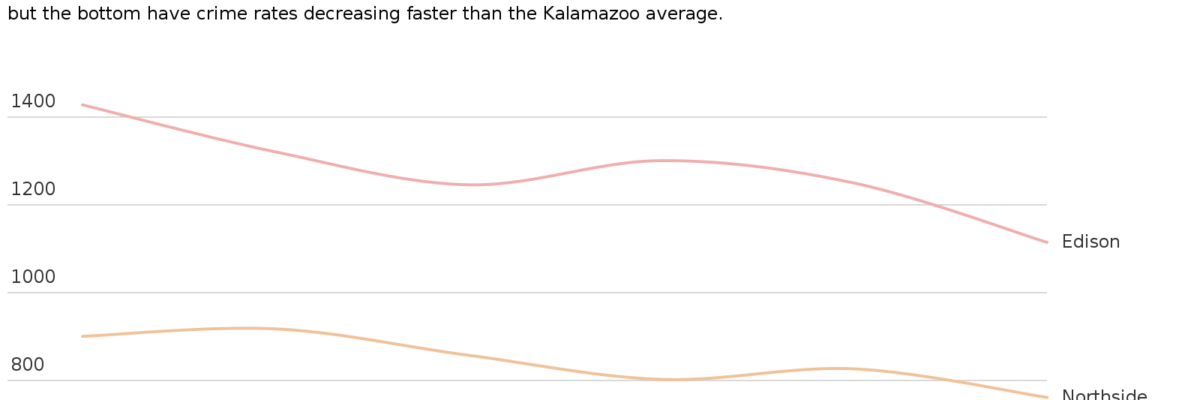
This post is about how to avoid inducing claustrophobia in your data visualizations. Too much text on a graph clutters it up, making readers feel suffocated. So let’s address the checklist item Labels are used sparingly. Sometimes, too much text isn’t the issue. Take…
How to Rock the Text in your Data Visualization
You only get a little bit of text in your graph. Here’s how to make sure you get the most mileage out of it.
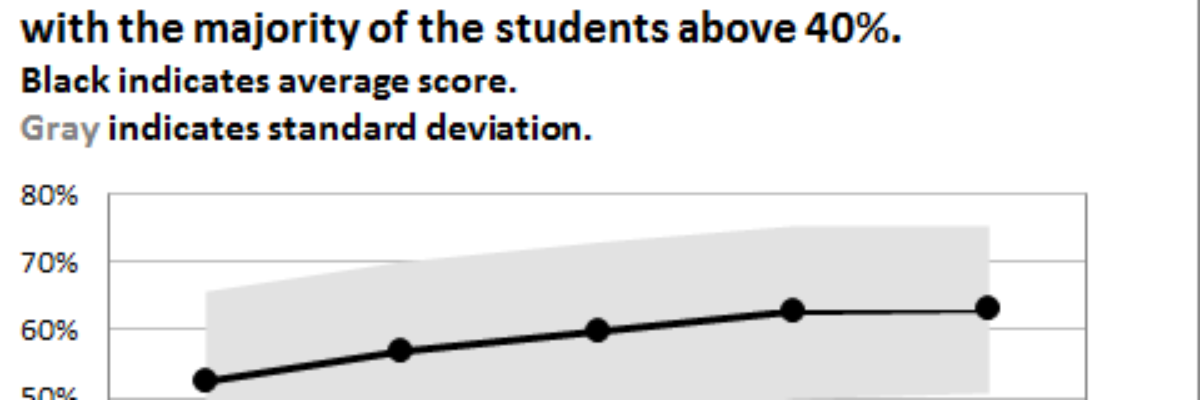
Adding Standard Deviation to a Dataviz
Do you need to communicate your standard deviations to your audience? No, I mean, really DO YOU? Think hard about that because chances are your audience doesn’t give a crap. They want to know you calculated your standard deviations. They want to know you were meticulous in your number crunching.
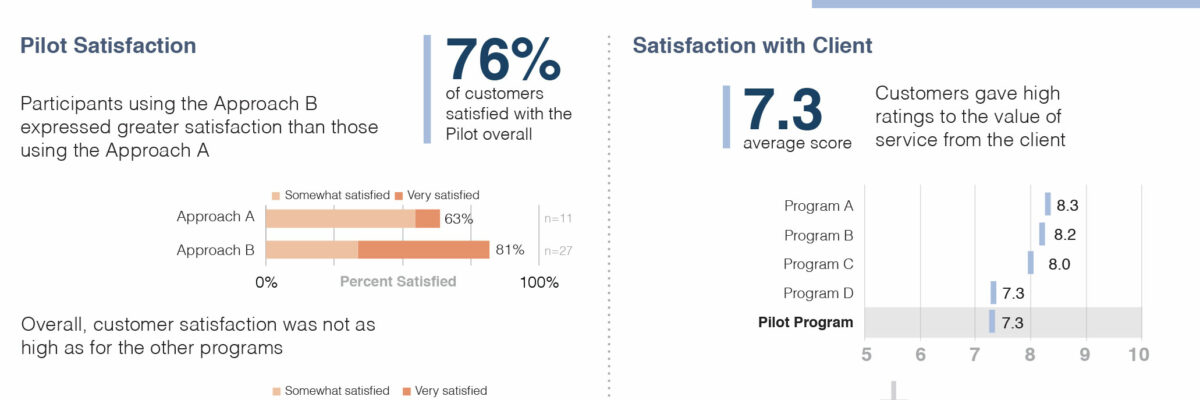
Guest Post: Using Visual Communication to Increase Evaluation Utilization
Hi! I’m Nate Wilairat with EMI Consulting in Seattle. We work with cities and utilities to evaluate energy programs and policies. I just started a data viz blog called Skopia. This blog post presents a few lessons learned from a successful effort to develop executive summaries for one of…
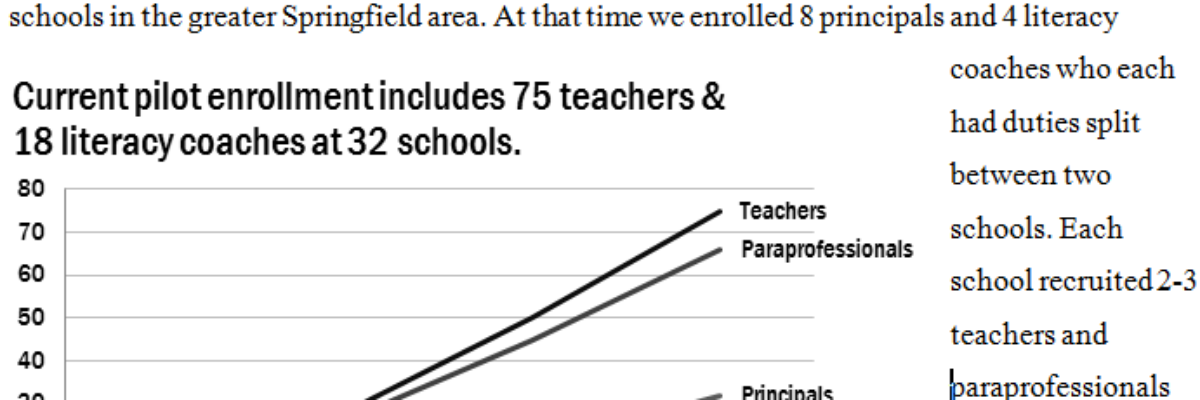
Design for Federal Proposals (aka Design in a Black & White Environment)
I just finished a round of reviews for a major federal grant program and was, like every year, inspired to share guidance on how to design in such a restrictive environment. Issue: Federal grant programs tend to specify the page margins, typeface, and font size to make the amount of…
Evaluation Executive Summaries & Reports
Examples of great evaluation reports and executive summaries ranks as one of the top questions I get by email. What’s a good exec sum look like? How long should it be? How do I incorporate graphics into a report without looking like a marketing firm? Read on, friends. I’ve pulled…
Reviewing Datawrapper
Have you tried out Datawrapper? The Guardian uses it for their data visualization reporting (learned after reading through lengthy but amusing comments and semi-argument on Few’s blog) so I figured it was worth checking out. Datawrapper is primarily used to embed graphics in a website, like…
Who Can Do Dataviz (or How a Field Evolves)
Wow, the action in the dataviz/tech world this past week has been awesome! A female programmer at a Python (that’s a programming language also used for dataviz) conference was fired after tweeting about the sexist jokes she was hearing from a largely white young male crowd, and Tableau’s…
My 2012 Personal Annual Report
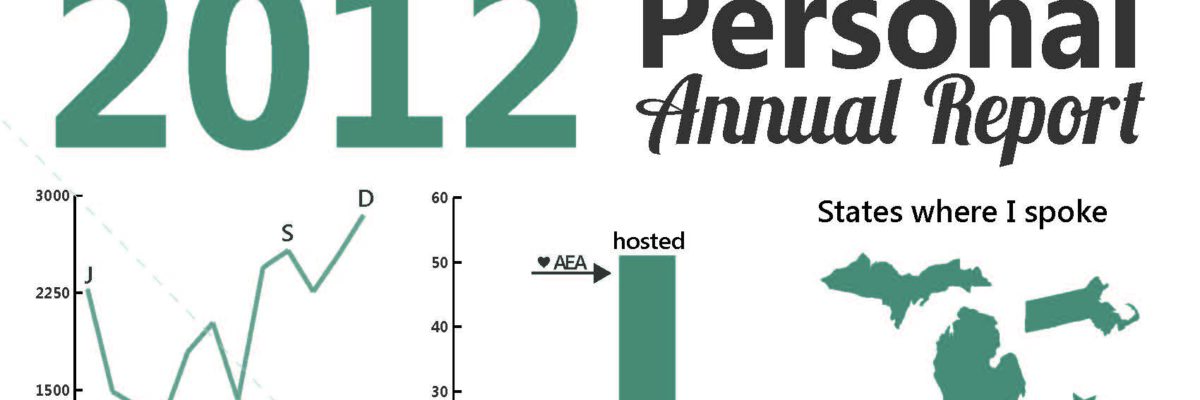
Yeah – It’s that time of year again! Here’s what I’ve been up to. Imagine if we could convince more clients to let us produce evaluation report summaries in this dashboard-esque format. Side note: I deviated from my normal routine and made this report…
