Wow, the action in the dataviz/tech world this past week has been awesome! A female programmer at a Python (that’s a programming language also used for dataviz) conference was fired after tweeting about the sexist jokes she was hearing from a largely white young male crowd, and Tableau’s new release seemed to spark both a long blog review by a frustrated Stephen Few and an interesting Twitter conversation that included comments like
the right question is “should a datavis expert use Excel?” My answer: Probably no.
Ouch. Who knew dataviz could mess with my emotions so much?
Well, I’ll start by giving this tweeter the benefit of the doubt. He’s a dataviz via Excel specialist. So maybe he was just joking. The larger conversation didn’t really indicate that, but maybe so. It’s hard to tell in 140 characters.
Even still, it brings up the larger question, coming off the backs of two dataviz conferences where specialty programming language was almost a prerequisite for entry, of what qualifies as dataviz.
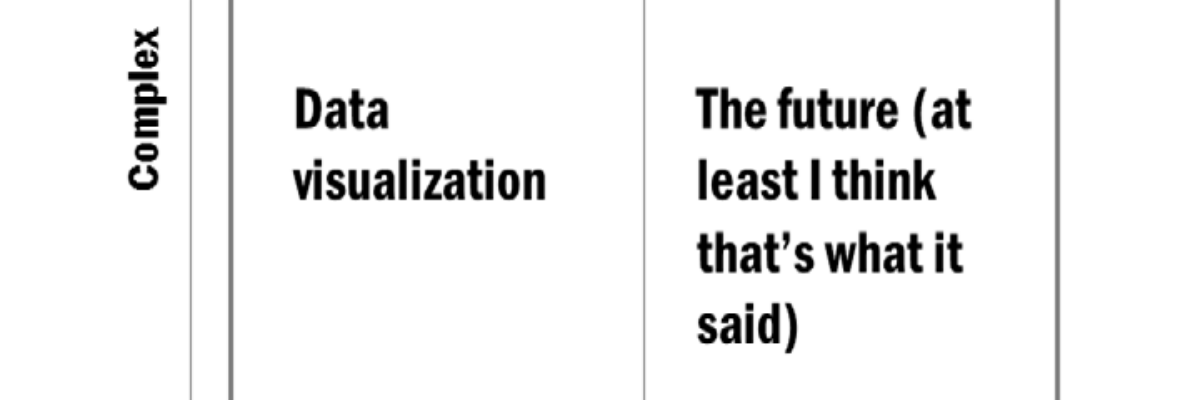
One tweet I saw during those conferences included a sketch of the speaker’s main point. I don’t remember the exact details of the sketch but it was something like this:

And it clearly suggests that those of us using Excel to work up regular ol’ charts and graphs into something spectacular are not engaged in data visualization.
You probably guessed that I don’t agree, and particularly so given that I have both a book and a volume of New Directions in Evaluation coming out that tackle data visualization with Excel. The fundamental idea behind data visualization is that one applies design principles to render actual data visually expressive.
That’s a broad definition and it’s platform agnostic. It could be done with pencil and paper. This blog post casts a wide net around what it takes to be a dataviz expert (and questions the use of the word ‘expert’). Qualities of an information designer (closely related) don’t mention a particular platform.
So why do these folks attempt to distinguish themselves and data visualization into something exclusive to those who can write code?
It’s funny, but we have seen extremely similar parallels in the world of evaluation. Evaluation is a fairly new field, with a very long history of being disguised as something else. (You’ve gotta hear Michael Scriven’s knowledgeable take on this matter.) In the efforts to let evaluation strike out on its own as legitimate, there’s this stretching and claim-staking of what it is and what it isn’t, often framed in a way most beneficial to the person speaking. It’s done to protect one’s status and membership in the club.
So I think these proclamations of what can be considered data visualization are attempts at taking a crack at establishing field legitimacy. It’s a normal part of field growth and development. And if the history of evaluation tells us anything, these proclamations are far from the final answer.
Are you a data visualization expert? Even a dabbler? Consider entering a data visualization competition that I’m helping to judge. $500 to the winner. You can use Excel.
