Though I have a PhD, I left academia to become a consultant and it was the best decision I ever made. But I’m still a research nerd at heart so when I had a chance to run a study that examined the link between graphic design and report use, I had to take it. I’ll tell you about the study and what we found in this post. We submitted a full paper on this to two journals and got rejected from both (and I’m telling you anyway, in the spirit of #ShareYourRejection). I know academics have more incentive (tenure!) and fortitude than I because after these two rejections, I tapped out. I don’t have the energy to keep submitting but I hope you’ll read through our study and findings and suggestions for continuing the research.
Nearly all research on the impact of graphic design or visual enhancements to reporting is simulated. Studies will use technology like Mechanical Turk to ask what they assume is a random sample of people whether they would, in theory, use the page being shown to them on their screen. Or, more accurately, the researchers ask if the page is appealing, assuming that appeal leads to use. Or, more accurately, the researchers ask the respondents to rate the extent to which they agree that the page is appealing, because Likert scales are easy to work with.
But that’s a far distance from actual use by real people in real decision-making scenarios. We conducted a study that works with reality.
I’ve been promoting graphic design as a skill everyone should learn since 2009. I now spend my days travelling around the world preaching this to organizations, all on the theory that graphic enhanced reporting makes it more likely to be seen, easier to digest, thus more likely to be remembered and therefore used. At least I was calling it a theory. And my dissertation relied on plenty of research that could connect the first four steps of this theory of change but we were all just making a leap of faith to get to use.
So let’s cut to the chase and then I’ll give you the back story. Did we find a link between graphic design and report use?
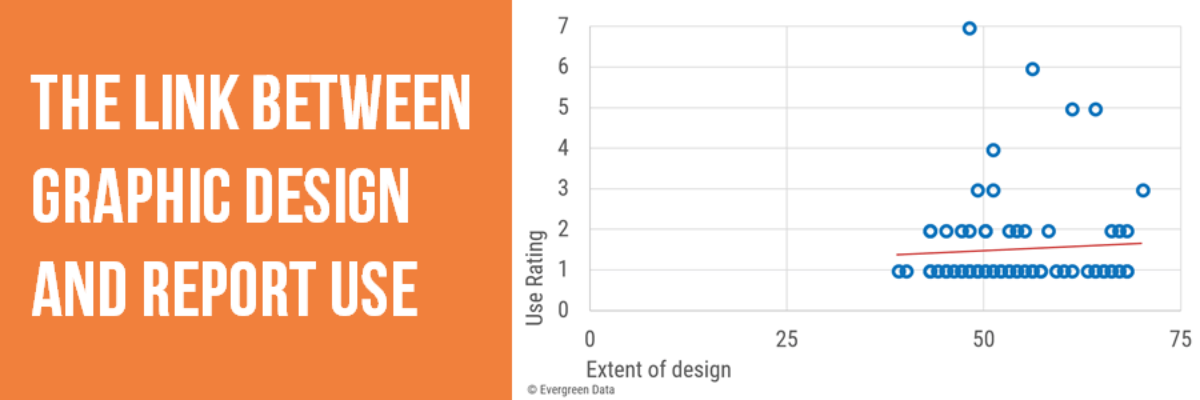
Not so much.

We examined the correlation between how often a report was used (cited) in congressional testimony and the extent to which that report incorporated good graphic design principles. There’s pretty much no correlation.
Why congressional testimony? Well, we were working with data collected by someone else. But more importantly, it represents actual report use in a real-life use scenario where the “subjects” don’t know data is being collected on them. We calculated use by looking the citations in recorded congressional testimony.
Real life use of reports and data is, of course, much broader than congressional testimony and I sure hope others will build off of this study and explore use in other settings.
What qualifies as good graphic design? I pulled together a checklist of good graphic design as part of my dissertation research. We had multiple trained raters review each cited report against the design checklist and correlated those scores with the number of times the report was cited in congressional testimony.
Way more details in the paper.
Not great news, I know. But let this be the first step in studying an area that urgently needs more research. I’m pretty sure there are some mediating variables, like politics and networks, that also influence whether a particular report makes the rounds among policy experts. Anyone up for studying those?
In fact, Dr. Sena Pierce just wrapped up her dissertation on the same dataset. She used the Data Visualization Checklist and multiple trained raters to score just the visuals in those cited reports and she did find some notable correlations. She’ll be publishing more on that soon. A second outcome of her study was the validation of the Data Visualization Checklist, which now has an interactive home.

Considerations for the next generation of researchers
The link between design and use is critical for any field engaged in evidence-based decision-making. As we note in the paper, we have much research on graphic design and data visualization, and reporting, by nature, should be actionable and useful yet the linkage isn’t supported by evidence. In addition, this study relies on secondary data which is always a strength in resource-constrained environments but relying on that secondary data ended up limiting the design and analysis because of issues such as skewed data.
Further, future studies need to account for the complexities of use and we included some suggestions in our current paper (e.g., multivariate analyses, more content analysis in addition to graphic design considerations that could serve as mediator variables) to help address this. Even the definition of “use” can be challenging and future researchers should work to identify, as we did, use scenarios that can be controlled without introducing researcher effects. Please read up on what we started and take it to the next level. Help advance the research in making connections between data visualization and use.
