Make a Slopegraph in Excel

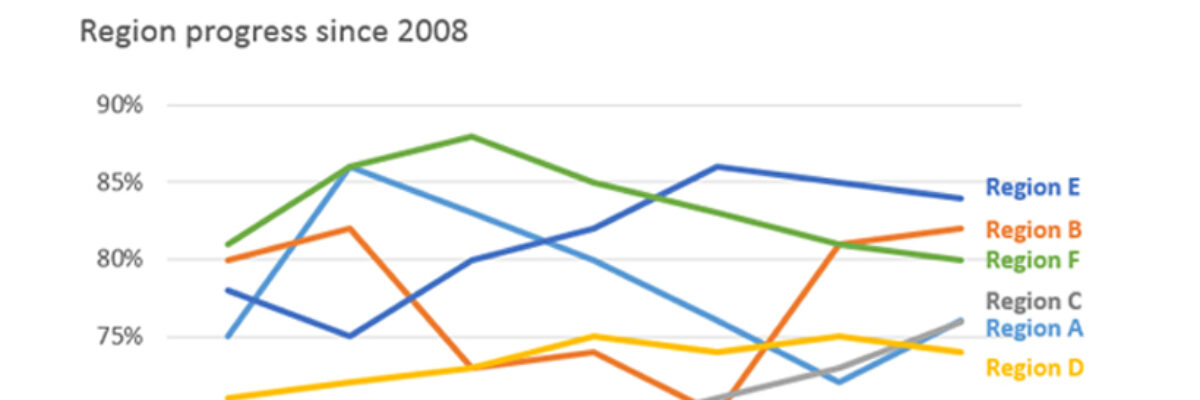
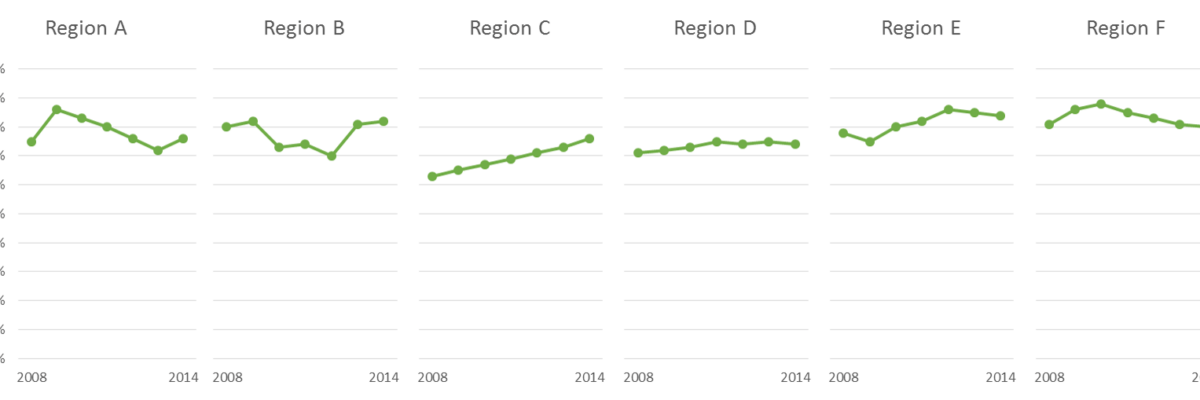
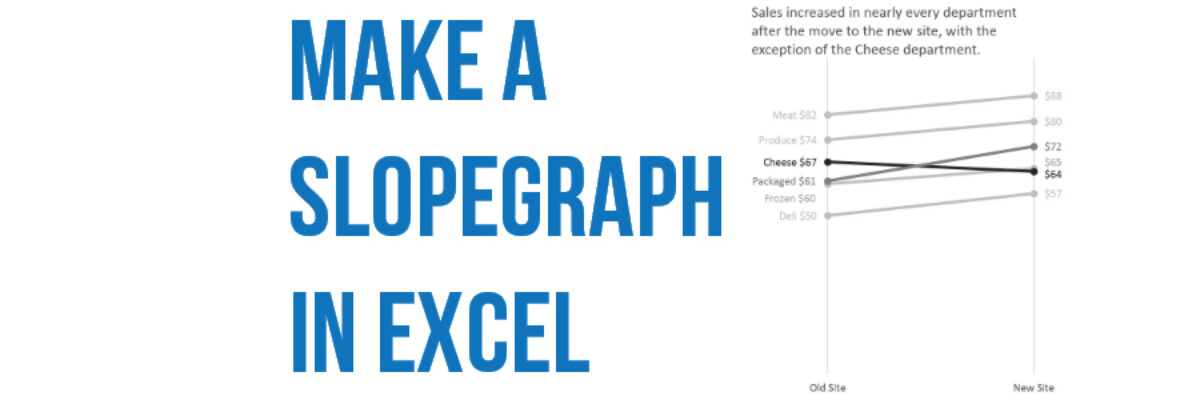
Slopegraphs are a newer graph type with powerhouse capabilities. They rely on Excel’s line graphing feature but they don’t necessarily have to show change over time. Slopegraphs play into our ability to judge slope fairly well. For this reason, they are perfect for highlighting the story of how just one…

Read More

President Obama’s Data Visualization

I realize it’s completely taboo to write about current events six months after they’ve happen but I DON’T CARE. One of my favorite events of the year is watching the enhanced version of the State of the Union. Not the regular view – the enhanced view. One side of the…

Read More

Academia, The Last Bastion of Change

Wherever I travel, without fail, the people who are most resistant to making the necessary changes to present data more effectively are academics. I wish I was kidding. After all, I used to be one. Some of my best friends are academics. Even the young ones who are on…

Read More

Visualizing Tiny Trends Over Time

I say: Trend over time? You say: Line graph! I know, that’s how it goes, right? We are so used to seeing trends over time visualized as line graphs that even my 3rd grader can interpret them with ease. But sometimes it helps to have other options that better fit your…

Read More

The Most Important Question in Data Visualization

What’s your point? Seriously, that’s the most important question to ask when creating a data visualization. And its the first thing I ask a client who sends me data for redesign. What’s your point? The answers drive nearly everything about visualizing that data. Here’s how that conversation often goes: Client:…

Read More

Visualize Branching Questions with Nested Area Graphs

This, my friends, is a nested area graph. I got this idea from the smart people at Innovation Network. And it is super amazing at visualizing the sequence of survey questions that branch. The kind where it says “if you said Yes, proceed to question 32” and stuff…

Read More

How a Dashboard Changes the Conversation

Presenting data effectively changes the kinds of conversations that can happen inside organizations. Better presentations shape an improved culture of decision-making. Let me tell you about a recent example of this. Late 2012 I got a call from an evaluation officer who was working at the Walton Family…

Read More

When It’s OK to NOT Start Your Axis at Zero

UPDATE: This post was written in 2014 and my thinking has evolved since then. Here’s the newest post on how to handle all of your axes. You can also join us at the Evergreen Data Visualization Academy where we banter back and forth about these ideas and apply…

Read More

Declutter Dataviz with Small Multiples

Are you making graphs that look like this crap? I won’t make you raise your hand. But let’s just agree not to do this, yeah? It’s SUPER hard to compare the tops of a bunch of bars. Two side by side bars per region ain’t so bad but beyond…

Read More