Labels are Used Sparingly

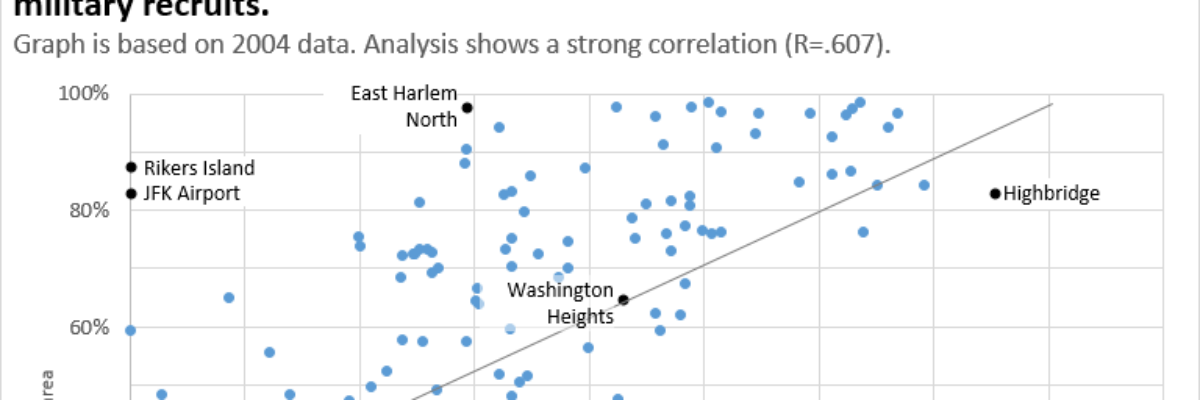
This post is about how to avoid inducing claustrophobia in your data visualizations. Too much text on a graph clutters it up, making readers feel suffocated. So let’s address the checklist item Labels are used sparingly. Sometimes, too much text isn’t the issue. Take…

Read More

How to Make a Diverging Stacked Bar Chart in Excel

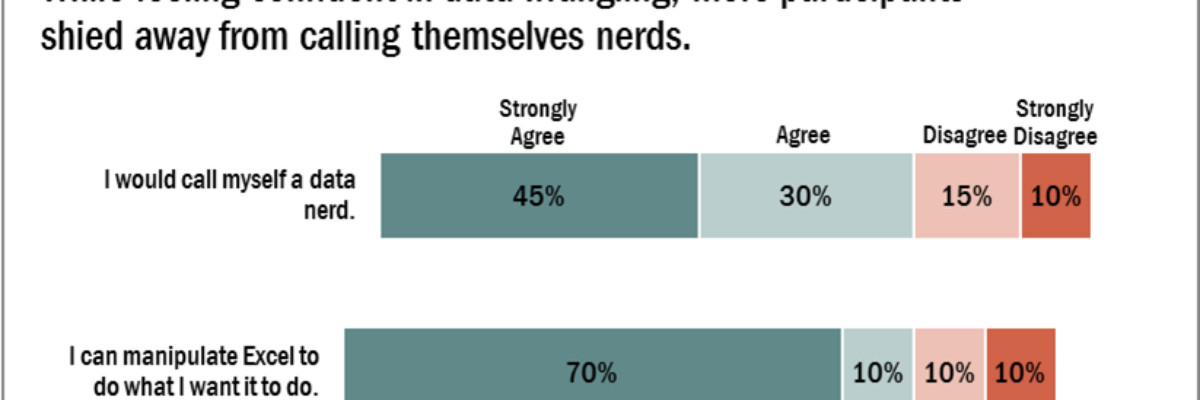
Last week my friend Ann Emery posted a dataviz challenge on something I’d been wanting to figure out for a long time: how to make a diverging stacked bar chart in Excel (I’d also heard of them as sliding bar charts, but getting our dataviz terminology on the same…

Read More

What Exactly is Happening in this 3D Chart?

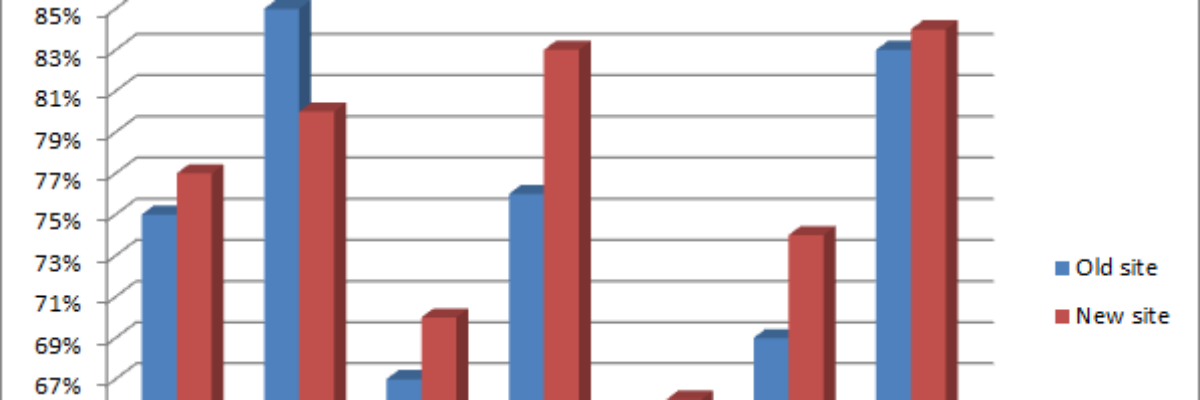
When giving advice about chart styles, one of my friends likes to say “save 3D for the movies.” She’s right – research shows that 3D charts actually slow reader comprehension. I’ve long advocated for the use of ChartTamer as a friendly way to restrict data visualization to that which will…

Read More