I realize it’s completely taboo to write about current events six months after they’ve happen but I DON’T CARE. One of my favorite events of the year is watching the enhanced version of the State of the Union. Not the regular view – the enhanced view. One side of the split screen is the regular blah blah talk standing ovation clap clap and the other side is the White House’s best attempt at presentation and data visualization design. Some of it is great and some of it is horrendous. Let’s take a stroll.
The Great
Storytelling with Pictures

This photo of the president and Rebekah Erler having coffee and chatting cued the story he told about her financial struggles. He uses story to tap into the listener’s emotional response and then segues into policy. As much as data people like to talk about storytelling to persuade audiences, no one does it better or has done it longer than presidents.
Quotes with Pictures


This quote gets humanized with a picture of the person who said the words. Further, the designers bolded the key words from the quote so the audience gets a quicker understanding of why this quote is relevant to the current discussion. I wish wish wish more researchers would add these enhancements to their qualitative data.
Annotations

When trying to show how something has changed after an intervention, label the moment of intervention right on the graph. This is a key item on the Data Visualization Checklist because annotations provide context that helps a reader understand. I don’t know what the heck is happening with the y-axis in this viz, but take away the helpfulness of the annotation.
Tolerable Donuts

Normally donut charts are a more irritating form of pie charts, but this is probably the one circumstance where they aren’t too bad. In this case, the donuts are really just some eye candy – no one is being asked to look at them and interpret a value. The value is listed right there! The donut is just decoration and I’m ok with that.
The Horrendous
Color Coding Gone Wrong

Adding an action color to key text is an awesome way to make your important points pop. But I think these designers forgot about color contrast. Because the words that stand out the most are those in white text, since they are on top of a very dark background. It might seem counter intuitive to switch the colors of the text chunks, but doing so would make their main message stand out.
The Yellows

We have about a bazillion colors to choose from, so why on earth are there two different yellows in the same graph? They don’t even really go together all that well. And with a disjointed legend, some readers will have a hard time connecting the year to the correct yellow bar.
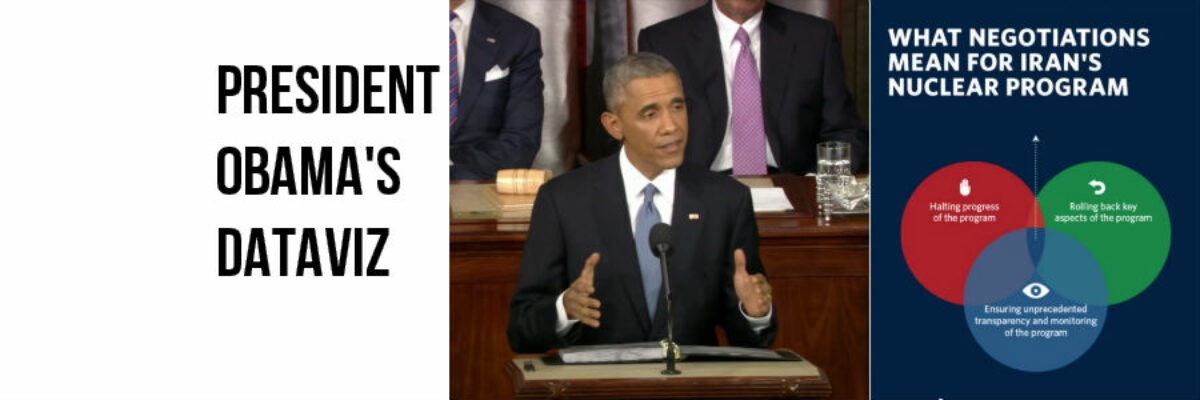
Venn That Leads to Nowhere

Venn diagrams sure are popular but way too often they aren’t the proper visualization. For a Venn to really work, every overlap has to be meaningful. Not here. For example, the places where the red and blue circles overlap don’t translate to anything for the US or Iran. Just because three things are happening simultaneously doesn’t mean they should be a Venn.
The Book Bar Graph

WTH is this? Do not fill the columns of your column graph with pictures. Do. Not. For a moment there, I was so distracted by the ridiculous books that I almost didn’t notice that this is also a truncated axis on a column graph. We judge the length of columns but our judgement is impaired when the length is improperly represented on the graph. This axis should have started at zero.
You have a good six months or so to rev yourself up for the next enhanced version of the State of the Union. Review this past year (you’ll find so many more great and horrendous) and get ready to geek out with me.
These examples contain a few smart ways to visualize qualitative data, but if you want even more, download my Qualitative Chart Chooser.
