Icons or symbols are an “easy” way to organize information throughout an evaluation report. I say “easy,” but I really mean easy for the reader. Symbol sets provide mental organizational structure. They often aren’t so easy for the report author, though. Usually it can be difficult to find a set of symbols through stock image sites that adequately fits the information being conveyed in the report.
Recently, I found this collection of icon sets – so awesome, lots in there, fairly general:
http://theelearningcoach.com/resources/icon-collection/
You’ll quickly see there’s a ton to dig through. Like the search for good images, it can often take more time than its worth to find a good match to your reporting needs. So here’s a quick way to make your own.
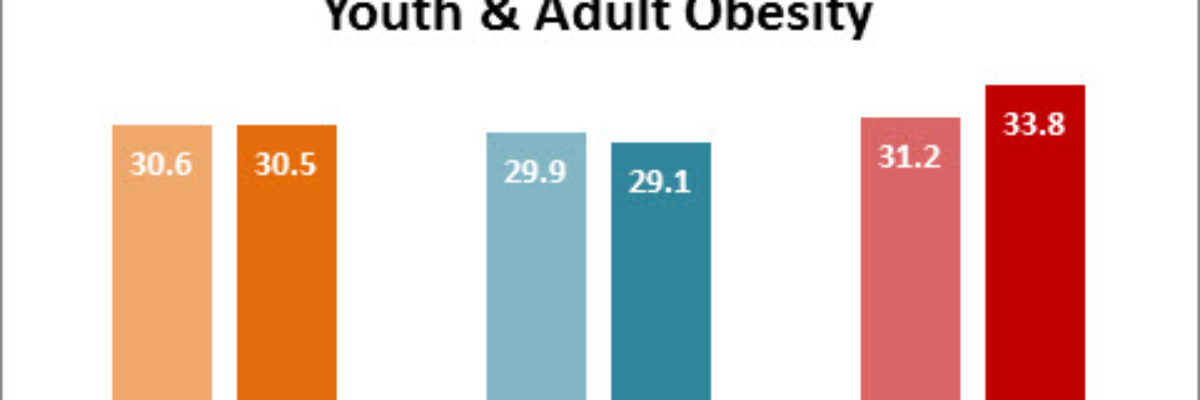
In this example, I’m trying to compare key indicators (rates of graduation, obesity, and home ownership) between Michigan, our nemesis to the south Indiana, and the national average. This is what the typical boring table would look like, yes?

I wanted to make similar-looking icons to represent each state. In the case of states, the shapes of each state could work, but purchasing state shapes via a stockphoto site was going to set me back about $30 (and think about the shape of Wyoming – would anyone really recognize it?) .
So I made icons myself in about 5 minutes. I started by typing the two-letter state abbreviations in a cool font (this is Gills Sans Condensed) and making them large:

Then I used “Text Fill” and selected white and “Text Outline” and selected black. I made the text box itself transparent, or no fill. Easy enough to get the cute outline letters, yes? For the shape, I just inserted a circle and used the “Shape Fill” and “Shape Outline” features:

I gave each state it’s own color to boost content organization even more. Then I placed the letters over the circles and grouped each letter with each circle:

The circles and the font really give it that feel of an icon set. Now I can use these to spark up my table:

Ok, I know it doesn’t do much to add icons to one table. But when we use the icon system throughout the report, we build a predictable organizational structure that speeds recognition and aids comprehension. See what I mean?

and

And I did it all without the aid of fancy graphic design software programs, with about 5 minutes of experimentation. Try it out for yourself! Enjoy!
