This is not news. Today. Yesterday. Every day. I fail all the time. Last week I was playing games that pay real money and failed to get anything out of them. This week, I have so many data visualization fails that I’m already planning a conference talk called The Compromises I’ve Made. I published some of my failures in a book edited by Kylie Hutchinson. This is an excerpt that I wanted to reprint here in hopes that it will help some of you handle your inevitable failures.
Before I Knew What I Was Doing
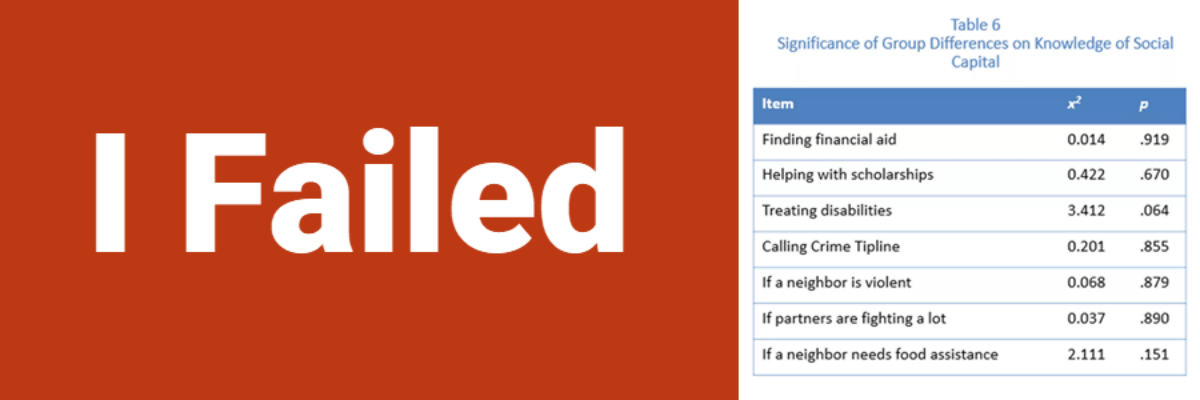
I co-wrote reports in which I included three-dimensional pie charts. We wove in tables of chi square values, as if our audience even cared or knew what that meant.

This design was so bad, our client had to give our report to a graphic design firm, who did what they could to turn it into something the client could actually distribute to their primary audiences. However, because most graphic design firms do not know how to communicate data effectively, the resulting version of the report did not include any actual data beyond the financial status of the program, a component that was not even part of our study. And speaking of showing financial status…
After I Knew What I Was Doing
I published a blog post that showed ways to visualize the financials page from nonprofit and foundation board reports. Usually this data is shown as just a thick table of numbers and people tend to skip it because tables are dense and hard to work with. I offered a redesign that used multiple small area graphs to show change in budgetary line items over a two-year period. In doing so, I had ventured into the y-axis debate because the scales in these area graphs did not all start at zero.

There’s a solid argument to be made that the scales in these charts shouldn’tstart at zero because we wouldn’t see any difference between the two years; all the lines would look flat. But there’s also a solid reason why they should start at zero—maybe I’m exaggerating the change if I don’t. Only the people who work closely with this data would know what kind of scale would fit best given the context of this foundation.
However, people on social media took notice of what they thought was a failure of mine and one commenter tweeted that “there’s no way [a dataviz Godfather] would approve this visual.” So, I got up the guts and sent the whole thing to the Godfather himself.
The Godfather wrote back: “To be honest, almost everything about your redesign is deceitful.” Ouch. I may have actually shed tears over this one. I was devastated.
A couple of days later, I got another email from him. I had hoped it would reinforce my position by clarifying that there are arguments to be made on either side of this y-axis debate. But, no. He wrote: “I realized that in my last email I used the term ‘deceitful’ when what I actually meant was ‘deceptive.’” Ouch again.
That’s when I finally started to laugh about this whole failures thing. Though I appreciated the Godfather’s follow-up, I was confident that my original design could be justified. Experience has taught me there isn’t always one “right” answer in the world of data visualization and design. I legitimately felt my position had merit and that my idol was respectfully short-sighted.
I made the best of the situation and opened a design challenge, inviting people to contribute better visualizations of the same data. Most of the people who originally pointed out my “failure” didn’t bother to participate. About a dozen people did, and the whole situation was quite collegial and fun.
A few months went by and I had long forgotten about that blog post. Then a professor emailed me to say that one of her graduate students had participated in my design challenge and she and her grad student had designed an experiment comparing my visualization to the grad student’s submission. As you might have guessed, the study concluded that his version was so much better (it wasn’t—he had the same scale issue that I did—but their leading questions tipped the scales in his favor).
Reaction 1: Shock! They thought my original visualization was that bad.
Reaction 2: Impressed! They had the guts to ask me to include my visual in their article.
Reaction 3: LOL! I have really leveled up in how well I can fail if people want to put it in print.
So *I* put it in print. Snag a copy of the book to read even more of my fails and the lessons I learned from them that help me stay sane.
Source: https://www.business2community.com/gambling/online-casinos-with-best-payouts
