Oh yeah – it’s my first ever guest post! I’m so happy to host Elissa – she does fantastic work. -Stephanie
My name is Elissa Schloesser with Visual Voice, I’m a freelance graphic designer specializing in communicating complex information and ideas. I work specifically with mission-based organization, and partner with a number of evaluators to create communication pieces that summarize evaluation findings for use with funders, potential supporters, and to be more broadly shared with the public.
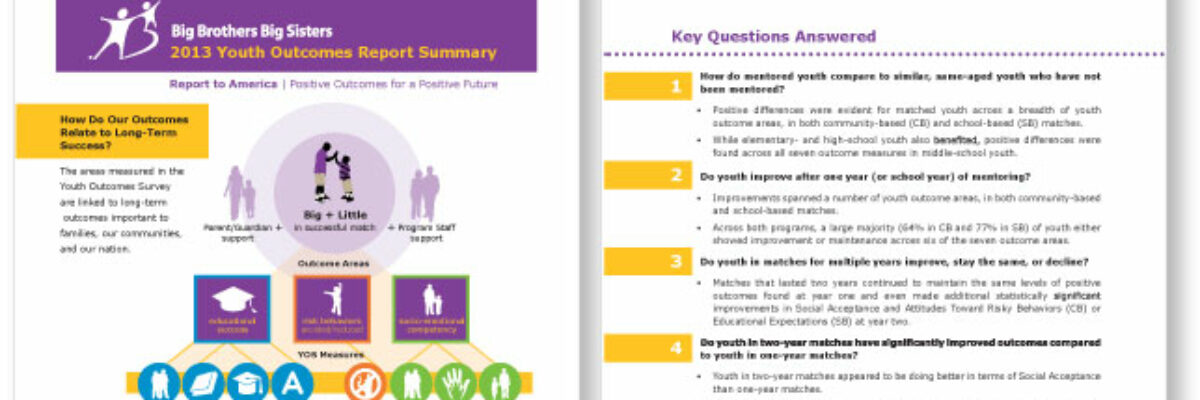
Creating a visual summary for your report is similar to writing its executive summary, but uses visuals and graphics to aid in the communication of your key information. It may be integrated within the full report or as a separate piece to be shared as a handout or posted online. It can be a great tool for engaging audiences in your key findings, especially ones who may not have or take the time to read your full report.

Here are a few tips for making yours particularly effective.
1. Take the time to plan before creating
At this point you have most likely analyzed your data and have a good understanding of your key findings. Before you dive into drafting your summary piece, I’d recommend pausing to do a little planning. Taking the time to think through some key questions will help you determine what information is most important to include.
A few things I like to cover in the planning phase:
- Why are we creating this piece?
- Who is our main audience?
- What question(s) should this piece answer for our audience?
- How will the piece be most likely shared and viewed?
2. Focus on communicating key findings not methodology
The primary purpose of a good visual summary should be to engage your audience and communicate your key findings. Therefore, you are going to want to feature your key findings in the summary piece and save the bulk of the methodology explanation for the full report. Hopefully, your summary will entice your audience to learn more and to read your full report anyway.
3. Translate your findings by putting them in context
It is important to present your findings in a way that resonates with your audience. For example, instead of just using percentages, try putting percentages in context (i.e. 1 in 10 people, rather than 10%). This is something that can also be done with number values as well (i.e. instead of saying 700 miles, say the distance between New York City and Chicago if this would resonate with your audience).
If your findings are more conceptual (i.e. a key finding is that partnerships are the cornerstone to organizational success). Draw a simple diagram that shows how various partnerships support one another.
Putting your findings in context will help make your data more engaging for your audience, as well as help you develop visual images to tell your story.
4. Make sure graphics enhance understanding
Anytime you incorporate graphics into your reports I think it is important to make sure they enhance understanding in addition to looking beautiful. This is particularly true for a visual summary because of the limited real-estate.
One quick way to check their value is by thinking about what would be lost if they were removed.
5. Keep it simple (this doesn’t mean simplistic)
Lastly, I like to recommend staying away from the temptation to incorporate all the latest special effects into your report graphics (i.e. 3-d graphs, shading, fancy borders, wild colors schemes). These types of special effects will actually make it harder for your audience to interpret meaning in your graphics, making them less engaging.
Instead, think about ways you can make your graphics engaging by layering information in a way that clearly communicates your main message, while providing supporting details in a less prominent way (but still available for those interested in it).
