So what do you do if your audience is asking you to show all the data? Here are a few solid ideas plus one key question to ask.
Show All the Data
Read More

So what do you do if your audience is asking you to show all the data? Here are a few solid ideas plus one key question to ask.
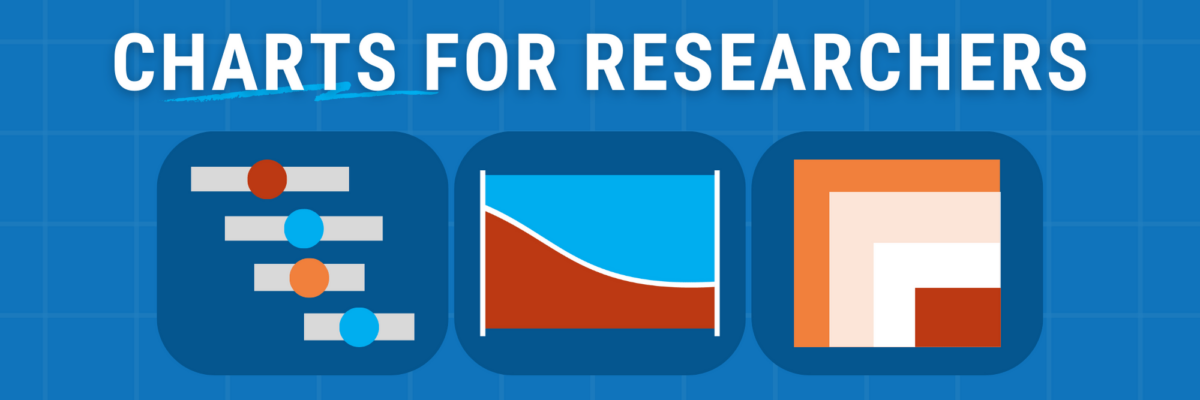
Of course your chart arsenal includes your trusty bars & scatters. Add these 3 to your mix to gain clarity, get more eyeballs, be better understood.
You’ll leave with at least 25 immediately implementable strategies & a list of the Black, Brown, Indigenous, queer, and disabled visualizers to follow as you work to become an ever better visualizer.
That dashboard you’re developing? That one that’s cost hundreds of hours? Wanna know why it doesn’t have the leverage you thought it would?
The most common question I get in my work, by far THE top question, is What software did you use to make that?
When it’s time to present your data, you’ll succeed if you learn about these three methods of circulation: slidedocs, slide handouts, and one-pagers.
When a bar is boring, buy a round of tequila shots. LOL ok that might work at your neighborhood pub but your bar chart is gonna need something else.
Or webpage. Or dashboard. Any place where you’re assembling data and a message. You need 3 elements. Your one pager needs to be:
Every. single. part. of a visual will be interpreted and assigned meaning. Whether you like it or not. Which means we’d better get thoughtful about design.
The myth: Your job is to design a great study, analyze the data, and then share it. Preferably in a journal article. That others will have to pay to access.