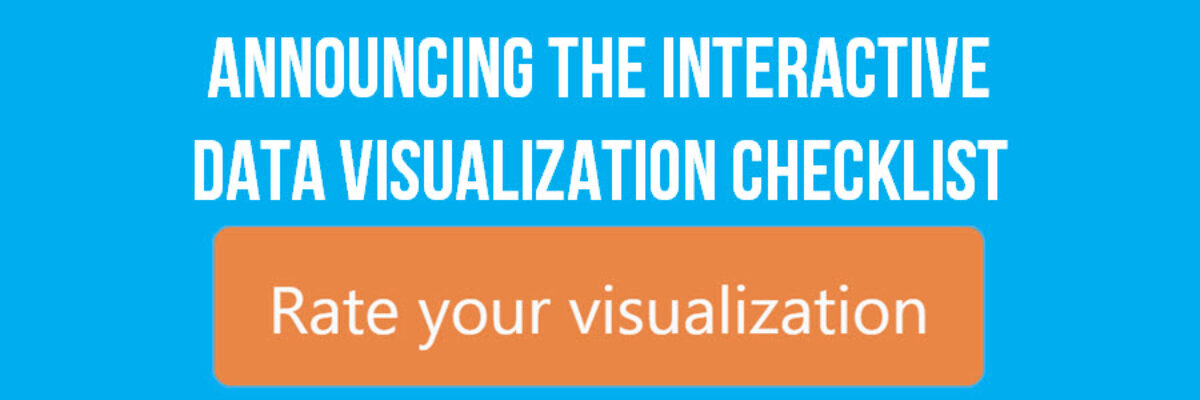
Delightful, strategy-shifting, and totally free ideas for your next data viz

Guest Post: Getting Started with Graphic Recording

By Lydia Hooper, Fountain Visual Communications Data visualization professionals often focus on numbers, helping to tell the story of what, when, where, and how much. But more often than not organizations first need to better understand the why and how. Before there is a need to communicate key insights from…

Read More

Qualitative Chart Chooser 3.0

Why isn’t qualitative data viz as well developed as quantitative data viz? Here at Evergreen Data, we are trying to tackle that. Qualitative data gives us more power to engage people’s hearts and minds. We are able to extend our data story to a more personal level. When we are…

Read More

Book to Read: Innovative Evaluation Reporting

When I first started talking about presenting data effectively, Kylie Hutchinson came up to me in her bad ass black leather jacket and said if I needed a mentor, she was available. That’s how cool she is. When I talk about how effective it can be to introduce the element…

Read More

Announcing! Kauffman Foundation Evaluation Report Guidance

The folks at the Ewing Marion Kauffman Foundation are serious about investing in the greater good and equally as serious about making sure those dollars have an impact. To that end, the hire organizations to investigate and evaluate what’s going on in Kauffman-funded programs. Those organizations apply the most appropriate…

Read More

How to Make Dumbbell Dot Plots in Excel

Data visualization is so cool because it helps you see things that would otherwise take a looooooot of effort. Here’s an example. Some very sweet clients in Maricopa County, Arizona (that’s the greater Phoenix area, friends) had a habit of presenting super important data in the most hard to digest…

Read More

Data Nerd Thank You Cards

In years past, I designed for you cards to help you celebrate Valentine’s Day and the winter holidays like the data nerd you really are. But truth be told, my favorite holiday is Thanksgiving. I love the food, the focus on family, and the deep expressions of gratitude. Does your…

Read More

Anyone Can Do Graphic Design, Even You

This is the kind of post you either love or hate. You hate it if you are a graphic designer. When graphic designers are in my workshops, they usually spend the first part nodding their heads in passionate agreement because I’m educating their research team on…

Read More

Don’t Visualize

Here’s the deal: People primarily look at pictures. That’s why we visualize data – to get people to look at it. But if we waste the short amount of attention people are willing to extend to us by showing them visuals that don’t convey…

Read More

Evergreen Collections

The end of August marks an important moment for me because it is when I quit my salaried job to work on data visualization and design full time. 5 years! It remains one of my best decisions. So, I like to celebrate it with you. Last year, I launched the Evergreen Data…

Read More

Visualizing Not Applicable or Missing Data

Yes, I know the jig is up. All of my examples in books and workshops are pretty tidy, as if every response options was addressed by every single respondent. The truth is that life and data collection are messy. How can we show that different questions have different sample…

Read More