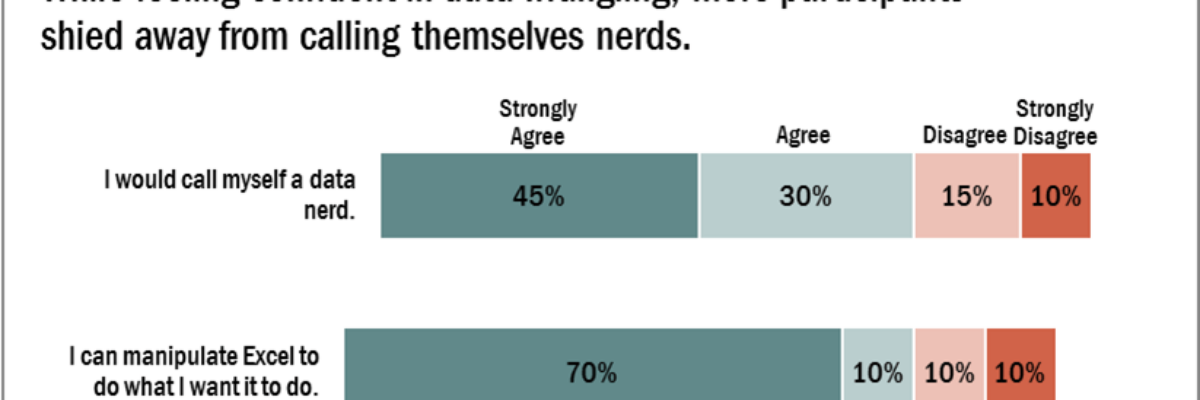
Man, do researchers love Likert-type data! You know what I mean – the kind of survey response options that range from Strongly Agree to Strongly Disagree (or vice versa, depending on your allegiances). Probably the most common way of visualizing that data is via a stacked bar chart, just like…
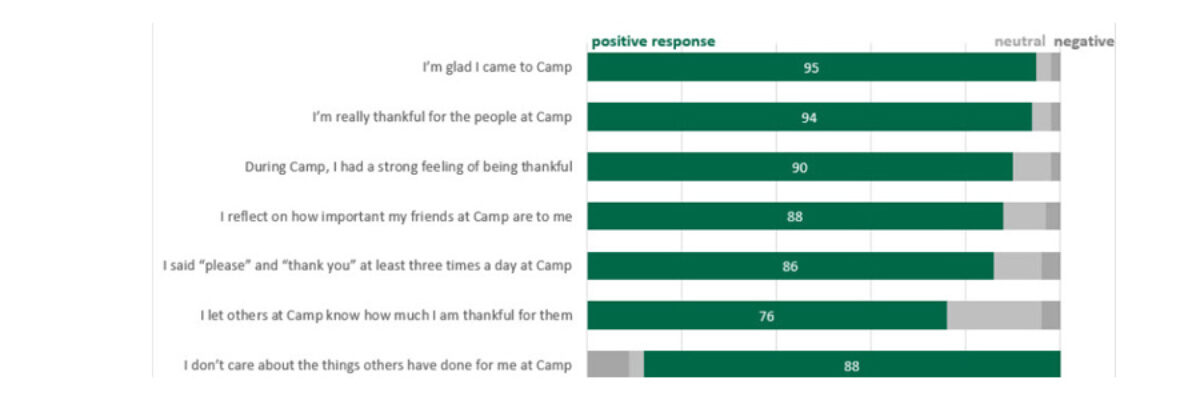
Visualizing Likert-type Data: Try Aggregated Stacked Bars
Read More