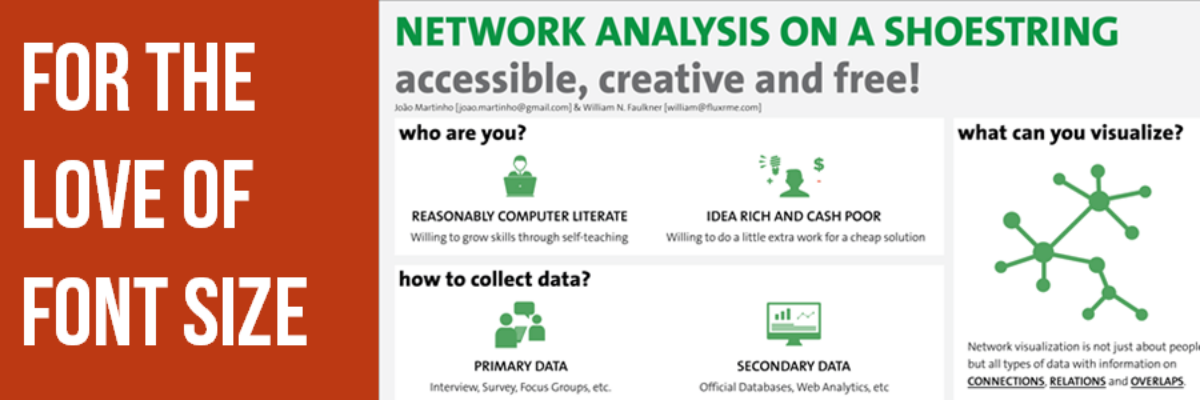
For the Love of Font Size

Did you know that you regularly read type set in size 8, or even smaller? In printed materials, captions and less important information (think: photograph credits, newsletter headline subtext, magazine staff listings) are usually reduced to something between 7.5 to 9 points. We generally read that size type without much…

Read More

Sidebars are Your Friend

Sidebars are an unsung hero of reporting. Sidebars are a way to offload details such as your methods or caveats about your data that are related but not a direct part of the narrative. Sidebars are not call out boxes. Call out boxes are for giving a tiny shout out…

Read More

The 1-3-25 Reporting Model

It’s time to talk about how a highly visual, well-formatted recommendations page doesn’t have much impact when it is buried on page 104. This is how we make reporting less cumbersome, particularly in a digital reporting era. Of course your reporting will probably include a slidedeck. I mean, you could…

Read More

The Wrong Kind of White Space

Long-ish reports are probably never going away entirely, so let’s make them suitable for a digital reading age. In the olden days, when we printed reports, they often had extra blank pages at the front and back. It probably gave printed materials a sense of refinement or maybe its used…

Read More

Largest Photo Service Gives Images Away for “Free”

Last month the world’s largest photo service announced that it would be giving away it’s photos for free. Say what?? Well, it was something like that. Get excited, but not too much. Getty Images announced that a portion of its gigantic, high-quality collection would be available at no cost. Sounds…

Read More

How to Effectively Present Quotes

When it comes to qualitative data, we have far fewer dataviz tools at our disposal. Another time, promise, we’ll get into word clouds and what Stuart Henderson thinks of them. Today, let’s tackle a more common method of displaying qualitative data – quotes. In reports, quotes are usually shown…

Read More

Bonus Post: Online Data Visualization and Reporting Classes

I’m taking my normal in-person speaking engagements online and you can come. I’ll be presenting one 90-minute class per month and repeating this entire series every 4 months. You’ll even get a sneak peek of examples from my forthcoming book (don’t tell Sage). Here is the lineup: Reporting to be…

Read More

Nix the Table of Contents

If the evaluation report is so long it needs a table of contents, you know you have gone too far. I have been researching the communication of evaluation findings in preparation for an upcoming webinar on the topic and because I have a horse I’m currently riding called How Not…

Read More