Have you ever worked for a client where you were going to have access to data so close to the chest that you had to sign a form acknowledging you could no longer trade their stock? That’s me, often, when I work with Fortune 100 companies.
datavis
Data Viz for Social Media
If you want your data to get consumed by more people, you have to design it for viewing on social media platforms where they consume visuals.
Ban Pie Charts in your Annual Report
Henceforth I’m calling for a ban on pie charts in annual reports. The ban will be lifted when a company is able to credit a data viz designer (even an internal one) as a contributor to the report.
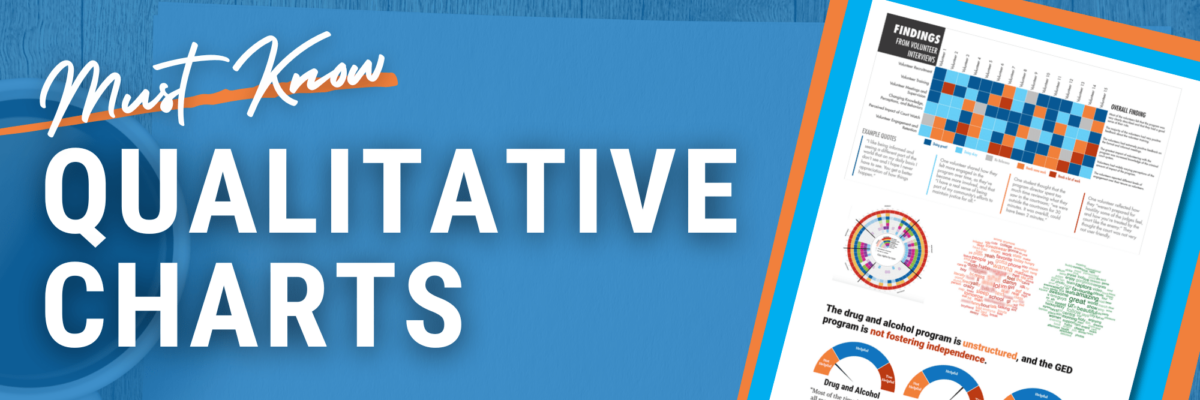
Must Know Qualitative Charts
Wanna learn about my favorites? Adding these visuals to your knowledge bank will give you new ways to tell stories and get people engaged with your data.
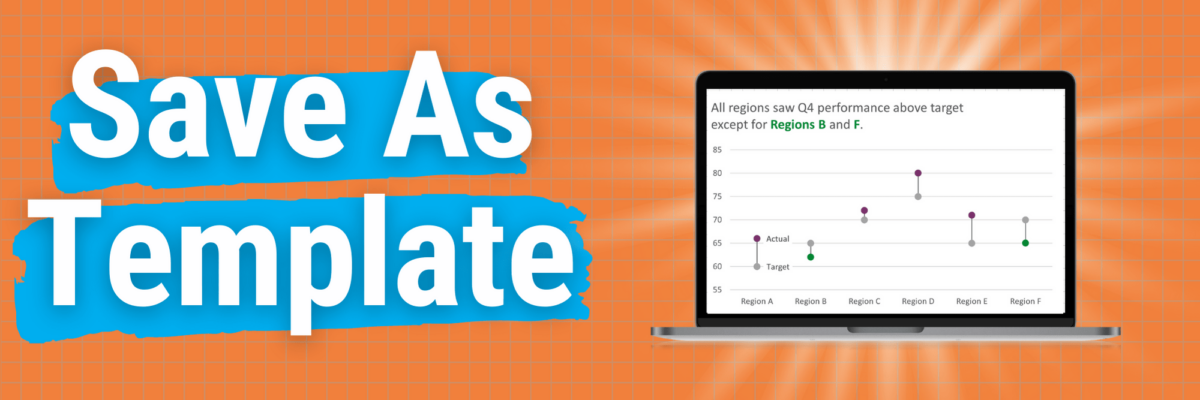
Save as Template
This is my A+ #1 100% best time-saving hack for making graphs in Excel. When you go through the process of making that one graph that’s totally perfect, you can save it as a template so it becomes, essentially, your new default graph. Here’s how. Right-click somewhere in…
Signs Your Data Viz Sucks
You might have landed here because you thought this was going to be a post full of snarky commentary on mediocre graphs. It isn’t. In fact, I’m not going to include a single data viz. Because what makes a data viz suck or sing isn’t just about its outward…
Data Viz Audiences
When people aren’t 100% sure you are talking to them, they ignore you. (Heck, when I’m jogging and the dude in the car is clearly talking to me, I still ignore him.) You want your audience to immediately see themselves in your data and how that data story is relevant…
How To Teach People Data Visualization
Have you ever accidentally taken one step too far down the internet rabbit hole? This has happened to me more than once when I’m trying to google the solution to why my chart isn’t working. I click into a Q & A forum that teases the answer – but the…
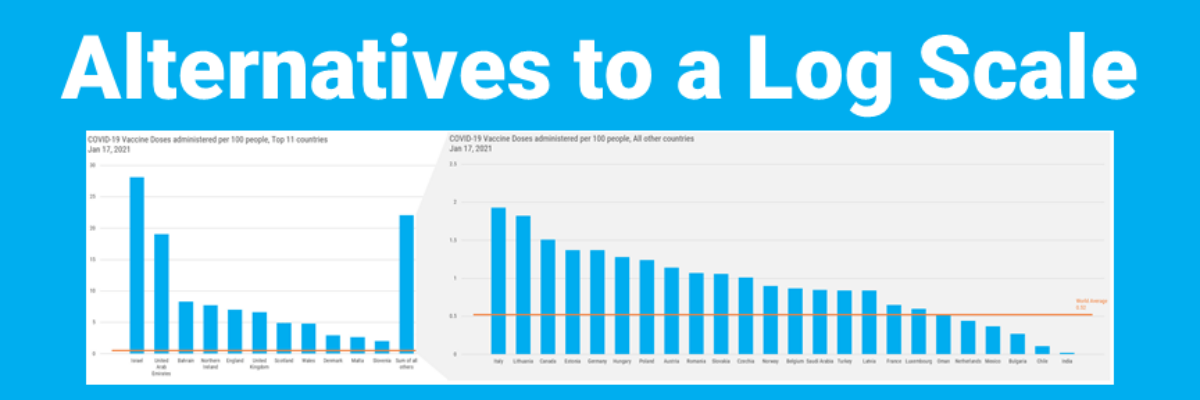
Alternatives to a Log Scale
Over in our private Academy Slack group, one of our members asked a solid, totally not snarky question about log scales. They’ve been common in visuals about COVID and there’s a fair question out there about how appropriate those are in graphs aimed at public consumption.
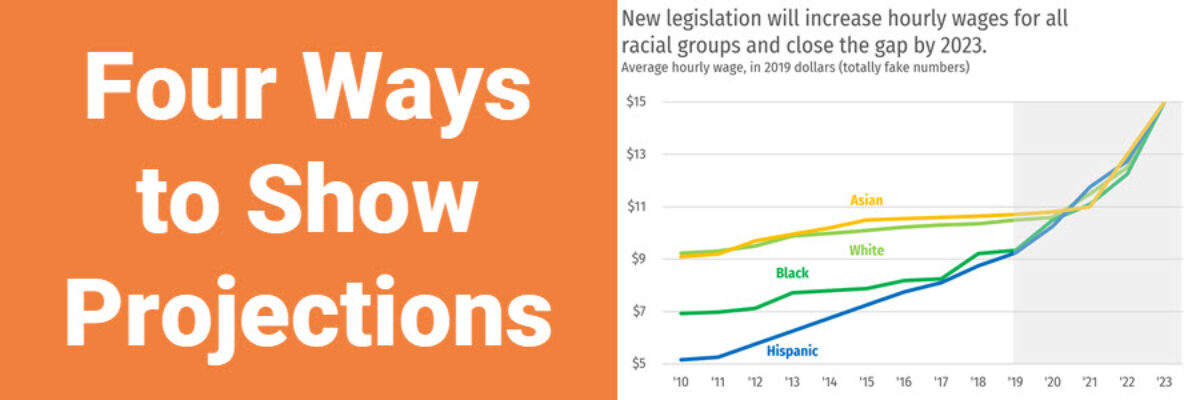
Four Ways to Show Projections
Of course we all want to know what will happen in the future. These days folks are looking at data like it has a crystal ball. To the extent that we provide our audiences with projected data, let’s talk about ways to visualize the projected data. Because here’s the thing:…


