Yowza, what a year! And it is only December 2! I’m writing from my hotel room in Boston. This week I’ve been working with Annie E Casey Foundation (Baltimore), Education Development Center (Boston), and the Ad Council (New York City) – and what a set to round out another awesome year of fantastic clients and fun travel. Thank you for following me in my far flung efforts to make data more useful and engaging.
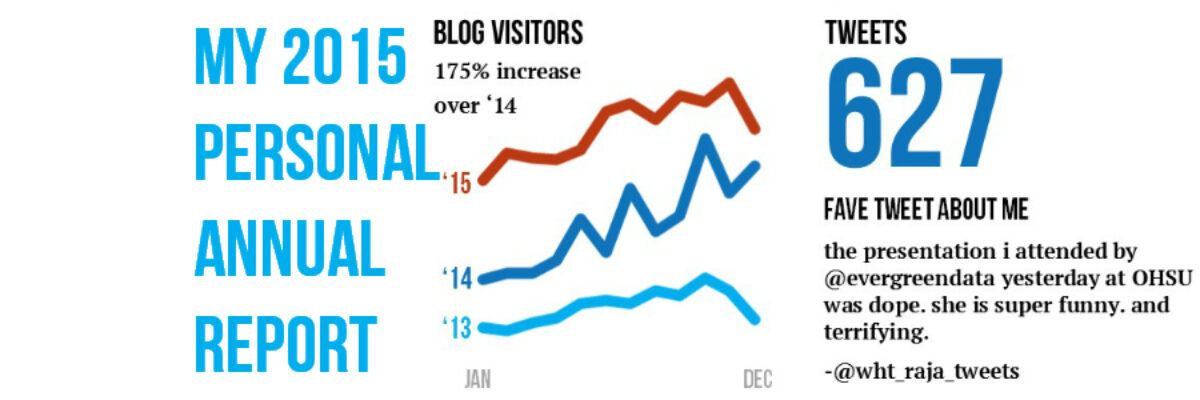
Like in previous years, I’ve summed up 2015 in a dashboard, accounting on my key indicators (December figures estimated).

I mentioned
my food and drink blog
my top blog post
my podcast
my next book
my datanerd cards
and how life is a lot more than the miles you can rack up.
And in my workshops I’ve heard of more than one person who has used my personal annual report as a template (one person even used it to get a raise – hint, hint) so I’ll make life easy for you since you’ve made it so good for me: email me if you want the Publisher file I used to make my report this year, then modify it to fit your specs.
Here’s to all charts trending upward in 2016.
