Yes, I know the jig is up. All of my examples in books and workshops are pretty tidy, as if every response options was addressed by every single respondent. The truth is that life and data collection are messy. How can we show that different questions have different sample sizes? The most appropriate visualization method will depend on how severe and inconsistent your problem is.
Note Small Consistent Missing Data
The easiest solution when data is acting like a tiny but equal opportunity absentee for every response option is to just make a note of it somewhere in the graph. My preferred location would be in a subheading, underneath the main takeaway point of the visualization. Make it smaller (in a report, like 9 point font) and gray.

If the data is missing consistently it is good to note but not a super critical issue. This treatment marks the issue but relegates its importance to a background matter.
Add Sample Size for Large Consistent Missing Data
Here’s everyone’s favorite nightmare: You sent your reliable research assistants out to collect data with some paper and pencil surveys… only one page of the survey was missing. It’ll be okay because you have more data but what to do with those questions that have many fewer responses? Note the sample size in the data label.
To do this in Excel, you can add the sample size to each data label cell in your table. Make a line break within a cell (on a PC) by holding down the Alt key while you hit Enter. In the formula bar, it appears broken onto two lines.
In the graph, it shows up as part of your data label, under its corresponding question. In this case, the prenatal question was asked on a different page but it was grouped with other healthcare data from the missing page for reporting purposes. The data label makes it clear that the sizes are inconsistent among the questions in this graph.

The same strategy can be used for large amounts of not applicable data. You can delete it from the graph but the remaining data labels need to note the sample size. Again, the strategy here is to note the absence in a diminished way, but still present and not ignored.
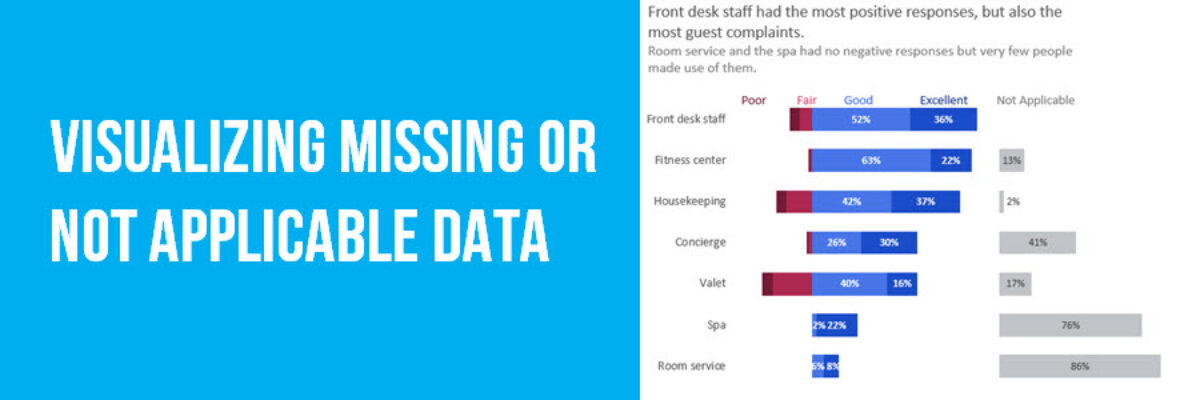
Add a Graph on the Side for Large Inconsistent Missing Data
The messiest data to deal with are those cases when lots of respondents skipped questions that weren’t applicable to them. The most accurate way to handle such data is to be super honest that it is gone and show as much in the graph – just off to the side.
To do this in Excel, we are going to combine visualizations: diverging stacked bars and small multiples.

The title here is important because it needs to explain why both graphs are included and necessary for proper interpretation. It’s a complicated concept. If it becomes difficult to encapsulate both graphs in a single title, it’s probably a good sign that you are trying to convey too much information and that perhaps the Not Applicable data should be dropped and mentioned in another way. If you do drop the Not Applicable data, go back to the previous suggestion and be sure to add the sample size to each label.
The overarching point is that you should treat the missing or Not Applicable data differently from the main data you collected. Your primary data needs to be seen in its own light.
This blog post is an excerpt from my book, Effective Data Visualization, which helps you choose the right chart type and then make that chart right inside Excel.
