Presenting data effectively changes the kinds of conversations that can happen inside organizations. Better presentations shape an improved culture of decision-making. Let me tell you about a recent example of this. Late 2012 I got a call from an evaluation officer who was working at the Walton Family…
dashboard
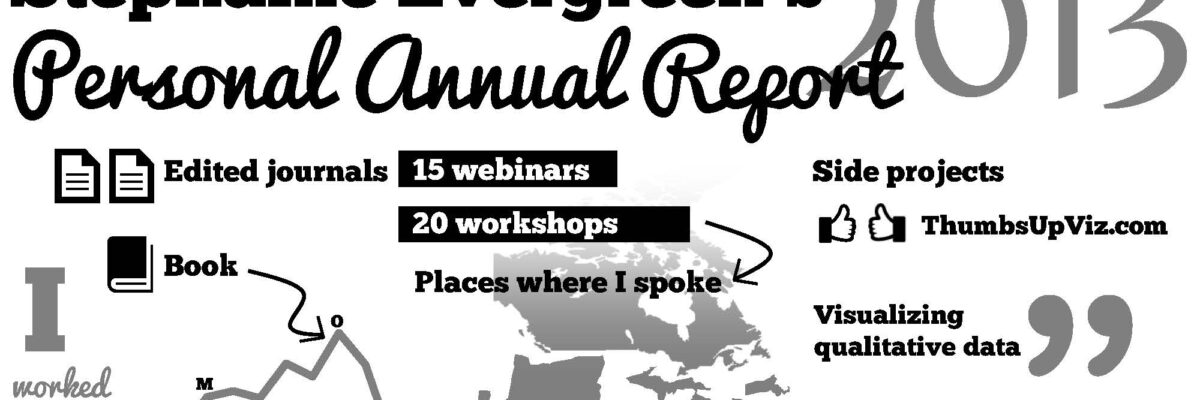
My 2013 Personal Annual Report
Holy crap, 2013 was a busy year! Look what I’ve been up to – and click around: [gview file=”http://www.stephanieevergreen.com/wp-content/uploads/2013/12/AnnualReport2013.pdf”] So, to recap, I’m prrrreeeetttttty sure I don’t have to publish one more thing until 2015. Whew. Some technical notes: Last…
Dashboard Icons in Excel
We don’t just report the facts, ma’am. We use a set of values to make judgments about the data, like which of these results is good or needs improvement, etc. We set benchmarks and cut points so our clients can understand when action needs to be taken and where. Yet…
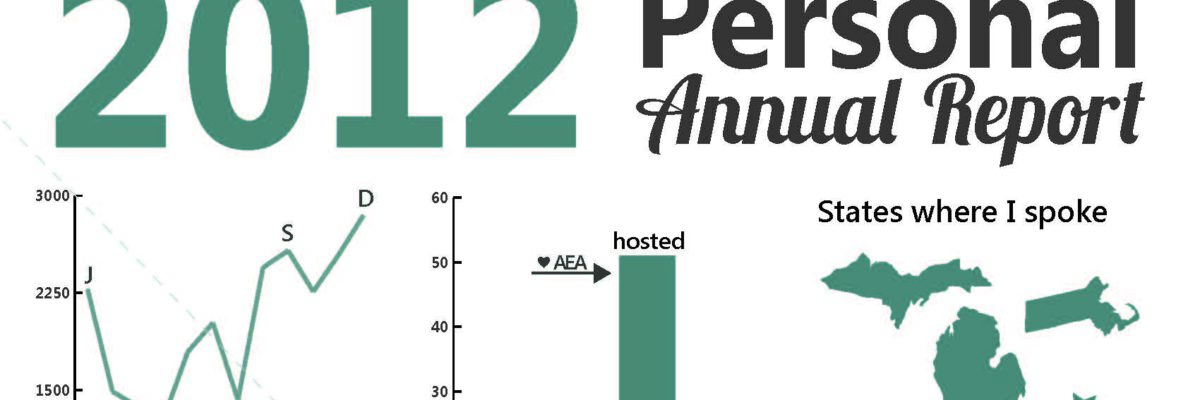
My 2012 Personal Annual Report
Yeah – It’s that time of year again! Here’s what I’ve been up to. Imagine if we could convince more clients to let us produce evaluation report summaries in this dashboard-esque format. Side note: I deviated from my normal routine and made this report…


